Year-End 2023 Report

It has been a successful year for our accounts, and we would like to highlight a statement from our year-end letter in 2022:

“The Nasdaq will finish down over 30% this year. As we wrote in our last letter, we think a fair value for the S&P 500 is 3600. We are trading at 3800 now. That implies our risk from here is 5%, if everything goes according to plan, which, as we all know, never does. Could we go lower? Sure. Will it stay below that level? We don’t think so.”

Contrary to our projection, the S&P 500 did not trade down to 3600 in 2023. The actual low was right around 3800. As we write this letter, the S&P is trading at 4750. This is good news for us, as our accounts had a remarkable year. However, our views for the next year are less bullish than last year. Let’s discuss that.

In our third-quarter report, we highlighted that the U.S. Government will need to borrow around $1.6 trillion to fund our budget deficit in 2024. The Federal Reserve is also on track to shrink its balance sheet by over $1 trillion. The demand for money needs to come from somewhere, and we believe stocks will be one area that helps fund these cash needs. This need for money is likely to put a cap on stock prices in the near term. It’s not an exact science to say that investors, as a group, will sell $2.6 trillion of stocks to buy $2.6 trillion of bonds to fund the government due to various factors such as foreign buyers and sellers of debt, tax fluctuations, potential changes in spending, and the Federal Reserves policies. However, the money must come from somewhere, and in an election year, they aren’t going to raise taxes or cut spending. Where will that money come from? Our best guess is the stock market until the Fed decides to buy bonds again to fund the deficit.

Our view is that the markets are in a trading range until we get our fiscal house in order. We believe the top is around 5000 on the S&P 500, and the bottom is around 3800. We have identified a few areas that we believe won’t perform particularly well in this environment, and we plan to sell those positions and raise some cash in January. If we like a position, we will hold through the ups and downs the S&P gives us. If we think a stock can make 10% a year and bonds are at 4.5%, we will hold the stock and accept the volatility. If we are on the fence with a position or group, we will raise some cash.

Our current concerns are with the banks. We don’t believe the banking crisis has run its course yet. We anticipate more challenges ahead. In January, we will reduce some of our bank stocks that we think are most affected by our government needing to raise money. We will put that money in cash and wait for a better opportunity to buy other stocks. The last time we raised cash like this was in 2015, and we had to wait eight months before the market had a correction. We will see how it plays out this time.

Our biggest gainer for our accounts this year, in dollar terms, was BGC Group. The stock was up over 80%. BGC will benefit from all the bonds the government issues in 2024. The more debt they sell, the more bonds will trade, and the more money BGC will make. Some financial events (selling FMX) are coming that will give this stock a boost in 2024. We hope that news can push the stock to new highs.

Our worst performer in your accounts was Lumen. We believe the stock should be sold to another company, and we await an offer along those lines. We think there are numerous companies that would like to own this company and be willing to pay more than its traded for this year. That said, it hasn’t happened yet. This stock has been one frustrating ride, and we will wait to be taken out or they sell off more divisions to realize value.

We haven’t changed our view that we are in inflationary times. Free trade is being reversed, aging populations worldwide are less productive, and we see the potential for capital controls increasing worldwide. We don’t think these trends are easily reversible regardless of the party in power in Washington. One interesting note on the inflation front is one of the strongest stock markets in the world this year is Mexico’s, which is up 42%. We have been owners of Latin American stocks for five years, which we view as inflation proxies. Mexico is also a big beneficiary of the trade war with China as US companies outsource to either Mexico or the US.

As we said at the beginning, we think the markets will be more challenging this year than last, whichmakes sense. You don’t make 20% or more a year on a consistent basis. We do like the valuations on our oil and inflation stocks and plan to hold them this year as the market digests the gains of 2023. Oil stocks have been hurt as governments across the world released oil into the market from their version of the strategic petroleum reserve. In the US, we sold half our oil in the SPR that is set up in case there is a war. You can’t do that twice. We continue to think there will be pressure to the upside on oil, and that will hurt our inflation stats.

It was a great year, and we had a wonderful Holiday party. We look forward to seeing all of you in 2024.

Sincerely,

Mark Brueggemann IAR Kelly Smith IAR Brandon Robinson IAR

Market Exhibiting Diverse Performance

We finished our letter as we usually do during the last week of the quarter. We decided

to have ChatGPT rewrite what we wrote to prove a point about how AI is going to

change how we work. Below is that letter.

I hope this letter finds you well. I am writing to provide an overview of the current

market situation and discuss some key developments in the field of artificial intelligence

(AI). Additionally, I will share our views on the winners and losers in this landscape and

touch upon other important factors that may impact investment decisions.

The markets have exhibited diverse performance, with notable variations among

different indices. Year-to-date, the QQQ index, which represents non-finance and

energy stocks, has shown strong growth of 27.9%. In contrast, the Dow Jones has

experienced a more modest increase of 3.8%. Small cap stocks have risen by 7.2%, while

the Value Line composite, reflecting the average stock performance irrespective of

market size, has shown a 6.8% increase. Naturally, this leads us to question the

underlying reasons and logic behind such divergent trends.

ChatGPT, the AI program I am using to compose this letter, represents a significant

advancement in software technology. It possesses the capability to enhance

productivity and solve various problems with minimal human intervention. Unlike

conventional operating systems like Microsoft Windows or Apple iOS, ChatGPT can

assist with tasks such as homework completion and software program rewriting.

Notably, ChatGPT's unique feature enables you to input 20 keywords and request an

article in the style of renowned authors like Mark Twain or Ernest Hemingway, although

it may contain some mistakes that would require your correction. The efficiency of

ChatGPT allows you to have a complete letter in just 5 minutes, which you can then edit

to your satisfaction. It can even aid in website creation if required.

ChatGPT was initially released in November 2022, but it gained significant traction

within the tech community starting in March of this year. It quickly became evident that

this program is a game-changer. Game-changing platform shifts are rare in the business

world, with examples from the past including the advent of personal computers,

landline telephones, the introduction of the first iPhones, and the emergence of the

internet. Each of these transformations brought substantial winners and losers, and this year,

Wall Street is actively identifying those who will excel and those who will lag behind in the realm of AI.

Returning to the aforementioned market performance, the QQQ index has exhibited

remarkable growth of 27.9% thus far this year. Microsoft holds the largest position

within the index at 12.86%, closely followed by Apple at 12.39%, Amazon at 6.91%,

Nvidia at 6.88%, Meta at 4.22%, and Tesla at 4.04%. Notably, our portfolio includes

significant holdings in Apple and Tesla. Wall Street has been aggressively driving up the

prices of these stocks, anticipating that one of these companies will emerge as a major

AI frontrunner. Tesla, in particular, has experienced an impressive surge of 99% this

year, while Apple has seen a 44.5% increase. However, apart from Nvidia, none of these

companies have yet witnessed substantial AI-driven earnings. Nonetheless, investors are

purchasing these stocks in anticipation of their future success in the AI field.

Now, let us examine the early winners and losers in this competitive landscape. Nvidia

stands out as the leader, manufacturing the fastest chips worldwide. In order for AI to

function optimally, low latency and substantial computing power are essential, and

Nvidia excels in these areas. Other semiconductor companies are currently playing

catch-up.

In addition to computing power, abundant data is a prerequisite for successful AI

implementation. The remaining five companies mentioned earlier possess vast data

streams derived from their interactions with customers. This valuable information can

be effectively utilized by AI to enhance marketing strategies and improve profitability.

Furthermore, since AI enhances programming efficiency, these companies can reduce

their programmer workforce and subsequently lower costs. Among this group, we

believe Tesla is the standout winner. Their development of self-driving cars utilizing

artificial intelligence, specifically neural networks, grants them a significant advantage

over competitors. This could explain the doubling of Tesla's stock price this year. When

driving a Tesla, data is recorded and transmitted via your home Wi-Fi to their cloud

computing sites for analysis. This proprietary data represents a substantial asset for

Tesla, in our opinion.

Lastly, in the AI realm, fast internet connections are crucial to reduce latency and

facilitate the data requirements of AI as it communicates with various cloud computing

sites. Lumen appears to be the most promising company in this regard. Despite their

recent poor stock performance, we believe they hold a significant position in this land

grab. However, they must demonstrate that they possess the superior solution for data

transfer before their stock can rebound. Although our performance with Lumen has

been disappointing, we intend to retain our position.

It is worth noting that the performance of the other 10,000 stocks traded on the market

may appear less appealing due to the dominance of AI. However, we maintain a

different perspective while acknowledging this viewpoint. Our strong belief is that

inflation will persist as a significant issue for several years. Additionally, we are of the

opinion that the U.S. Federal Reserve is constrained in its ability to raise rates

substantially without risking damage to the financial system. The banking crisis we

witnessed when rates reached 5% serves as a stark reminder. If rates continue to rise,

the federal government will face budgetary challenges as an increasing proportion of tax

dollars is allocated to interest payments on the national debt. It is highly unlikely that

any federal agency will be eliminated to accommodate debt interest payments.

Consequently, the Federal Reserve will likely be compelled to resort to monetary

printing at some point, regardless of whether inflation surpasses 2%. We believe our

investment strategy positions us favorably to capitalize on such circumstances, more so

than if we were invested in only AI stocks or cash.

Turning our attention to the price of oil, recent developments have significant

implications. When tensions arose between Russia and Ukraine, oil prices surged to

$120 due to supply concerns. Presently, oil is trading at $70, despite the ongoing war

and persisting supply worries. The United States maintains a petroleum reserve known

as the SPR (Strategic Petroleum Reserve), which stores oil in the event of war. This oil

would be utilized for military operations if a conflict were to arise. The SPR has been

operational for nearly 50 years, and as of July 2020, it contained approximately 650

million barrels. However, the current inventory has dwindled to around 350 million

barrels, the lowest level since the 1980s. It is difficult to envision further reduction in

this inventory. The current administration has opted to sell the oil to lower prices and

mitigate inflation. They have expressed their intention to replenish the reserve when prices reach $65 to $70, the range we find ourselves in presently. While the United

States has been releasing oil, OPEC has concurrently reduced production to

counterbalance these releases. Furthermore, due to environmental concerns, oil drilling

in the United States has decreased by 70% compared to levels seen between 2012 and

2014.

In conclusion, we believe that the short-term decline in oil prices resulting from the one-

time release of the SPR is an artificial phenomenon. Simultaneously, domestic oil drilling

has experienced a significant decline, while OPEC's production cuts further impact

supply dynamics. These factors indicate the potential for a substantial oil price

movement in the near future. Alternative energy sources, such as solar and wind, have

maintained a steady 20% share of total energy production over the past decade. It is

unlikely that they can offset a surge in oil prices. Consequently, we foresee a challenging

path forward without a significant price increase. If you don’t share this perspective or

would like further discussion, we encourage you to reach out to us.

Yours sincerely,

Mark Brueggemann IAR Kelly Smith IAR Brandon Robinson IAR

P.S. As you can tell from above, ChatGPT was able to edit our letter, correct grammatical

errors and write in a style we are comfortable with. The ramifications for this type of

technology are going to be interesting to follow for all of us.

We want to remind our clients that in September T.D. Ameritrade will be merged with

Charles Schwab. Your statements will now have the Schwab logo on them in October.

We will still be your advisors, and nothing has changed in how we will manage your

money. They will change your account number and the log ins may change as well. Feel

free to call us and we will help you with any questions you have. In the meantime, you

don’t have to do anything on your part to implement these changes.

Bonds & Stocks Had a Rough Year

There is a saying on Wall Street, “There is a bull market somewhere go find it.” This year it’s

hard to find one. Stocks are down, bonds are down, cryptos are down, gold is down and that

leaves oil and grains as the only bright spots. We own a lot of commodities so that has helped,

but it didn’t offset the other groups’ decline. We will elaborate on that in this letter.

After three good years in the market, our accounts were due for a decline, and we got one. This

year will be the fifth worst market for a combination of bonds and stocks since 1900. This will

be the worst year for U.S. Treasuries on record. The S&P 500 will finish down around 20%,

which puts it squarely in the bear market category. The Nasdaq will finish down over 30% this

year. As we wrote in our last letter, we think a fair value for the S&P 500 is 3600. We are

trading at 3800 now. That implies our risk from here is 5% if everything goes according to plan,

which as we all know never does. Could we go lower? Sure. Will it stay below that level? We

don’t think so.

The Federal Reserve will continue to raise interest rates until something breaks in the economy.

With rates on the short end now at 4.5% we think that we are close to the breaking point.

Housing has slowed down. Layoffs have begun particularly in tech companies and job openings

nationwide have started to decline. At some point this will stop the rate rises of the Fed and the

markets will respond positively. We don’t expect rates to suddenly drop on the short end, just

stopping going up will do the trick. We think rates at 5 to 5.5% are the top in this cycle. If that

number is reached, we think it will be in the first half of this year, assuming we have that right,

then what?

There have been 11 years since 1900 where the market for both stocks and U.S. Treasury Bonds

have been like this year. The average decline was -17% (this year we are at -14%) in those 11

years. The next year the average rally was plus 13% with only one year being a down year. That

year was 1931 when bonds and stocks lost -31%. The most recent years like this one were 2002

and 2008. In those two years a 60/40 stock bond portfolio lost 8% and 17% respectively. In the

following years of 2003 and 2009 those portfolios were up 17% and 11%. Our base case for

2023 is an up year for the markets. What about our stocks?

Let’s start with the biggest losers for this year in our accounts. Tesla is down over 70% this year.

Most of that occurred in the last eight weeks of the year. It’s hard to talk about Tesla being a

loser for us when we took profits on it in 2020 and 21 but 2022 was a mess. Operationally the

first three quarters of this year were good. We think Q4 will indicate a slowdown in demand in

China. This is going to affect them, but we don’t think it’s their biggest problem. When Elon

Musk bought Twitter, he had to sell some Tesla stock to finance it. The markets are trying to

figure out if he will be forced to sell more Tesla to fund those operations or not. The stock has

cratered 45% in the last six weeks to make it harder to fund Twitter. Hedge funds are also

shorting the stock to see if they can possibly trigger a margin call for him if the stock goes below

$100. We don’t think Musk’s tweets on non-car issues are helping people want to buy a Tesla.

We are hoping he gets a new CEO at Twitter and spends most of his time at Tesla. Until that

happens this stock is going to be very volatile and unpredictable. We continue to hold the stock

and have been buying some in this decline.

Lumen eliminated its dividend this quarter. We thought they would cut it in half (pay one billion

a year) but they didn’t do that. Instead, they announced they will buy back $1.5 billion in stock

over the next two years, which would shrink the float of the company by 25% to 30% at today’s

prices. We will see what their guidance is for the year when they report in February before

commenting further. We have them with free cash flow in 2023 of $500 million to $1 billion.

Depending on the amount of stock they buyback that would be 50 cents to 1.33 cents per share

in free cash flow. That said, nothing has been easy or good with this stock and count us as really

frustrated with this one. This stock has been a big loser for us this year.

Our inflation hedges were up for the year. Our oil stocks, gold stocks, steel stocks and Latin

American stocks were all up for the year. We own these stocks as a substitute for having that

money in cash. We think those stocks will do better than what we get paid in a money market.

That worked out well this year. We expect another surge in oil which will move these stocks

higher in 2023. If we get that right, we plan to sell some of these stocks and redeploy the

money in other areas.

We have owned Apple’s stock for almost 10 years now. It was down over 25% this year. We

continue to see them with an advantage that isn’t easily attacked by competition. We do think

the supply-chain problems China are having will slow the development of new phones in the

future. That slowdown will be offset somewhat by the gains they are making in services being

sold over the phone. Of all the tech stocks we follow, this one has performed the best this year.

That said, down 25% isn’t what any of us want.

We own a bunch of large money center banks as a play on rising interest rates. We got interest

rates going up right, but not the direction of the stocks. As a group bank stocks were down

about 20%. The investment community is convinced that loan losses are going to rapidly

accelerate and hit the banks’ balance sheets. If we were in a deflationary environment, we

would agree with that. Because we are having inflation above 5%, we don’t. This is a position

that will be sold in time if we get the right prices for them.

The world is convinced that we are going into a recession in 2023. It’s the base case for almost

all investors today. Hence the decline in stocks this year. The treasury yield curve is inverted

(long rates are lower than short rates) the most it has been in almost 40 years. Inverted yield

curves are usually a precursor to a recession. We think the economy will slow down in 2023 but

not enter a recession like 2008-9 or 2001-2. We think THIS economic slowdown is more related

to an inventory correction related to the supply chain than to an evaporation of demand in the

US. A lot of companies double-booked orders to get products when the supply chain messed

up last year. As the transportation crunch ended, so did their need to have too much inventory.

We saw this first hit in the big retailers who sell a lot of products from China. The other area

was semiconductors in cars. Those two areas were the worst hit and now appear to be running

normally. When companies go back to normal ordering patterns, we see that moderating the

slowdown in the economy in 2023.

We bought more Data IO and Transocean this quarter. Data IO should benefit from the

semiconductor shortage turning into a glut. Transocean should benefit from the world

resuming drilling for oil in the oceans. Both reported very good third quarter earnings.

What are we looking at these days? We have started looking at growth stocks and tech stocks

again. This is a year when the average tech stock is probably down over 50% from its highs if

not 70%. This was an extremely popular trade going into 2022 and it blew up. We are looking

for survivors in this group. Should we get the sells right on banks and commodities this might be

an area where the money goes. Stay tuned.

Our last comments are about our philosophy on how we view stocks versus other investments.

We will steal a quote from Buffett here which was, “In the short-term markets are a voting

machine, in the long-term they are a weighing machine.” What does that mean? In the short-

term where a stock goes in any month or quarter is just a function of order flow. If Wall Street

likes it, they recommend it and the stock has buying pressure. If they hate it, the opposite

happens. However, in the long run the earnings of the company will OUTWEIGH the short-term

popularity or order flow of the stock. Let’s give you an example. If company A is trading at $10

and it earns $1, that company is basically earning its investors 10%. If the stock drops to $8 but

it still earns that, $1 it now is earnings you 12.5%. As the money piles up inside the company

the WEIGHT of those earnings will eventually overcome any sentiment issues or order flow

(voting in his words) in the short term.

When we look at investing your money, we try and find companies that we think will earn 8% to

10% for you. If we get the earnings estimates roughly correct, it’s just a matter of time until the

stock reflects those earnings in a positive way. For the last 12 years interest rates have been

basically zero on the short end and that made owning stocks an easy call. With rates at 4.5%

today it’s harder. When we sold parts of Tesla and Apple in the previous years, it’s because the

yield we were getting had declined and the growth rate that it needed to grow to get to an 8%

or higher yielder with us was too optimistic. At the time we sold them, the stocks were

skyrocketing. Today they aren’t. It’s this balancing act between what you pay for something and

its growth rate versus the risk-free rate of Treasuries that makes this at times more of an art

than a science.

We mention this because when you have a crummy year like this one based solely on the price

of the stocks we own, it seems stupid to own anything. In our view as the WEIGHT of the

earnings keep piling up in our stocks, good things will eventually happen. What day or quarter

or even year depends on when these stocks become popular. It gives us comfort in this rotten

market to see the money pile up and know it will be put to good use at some point, either

through dividends to us or stock buybacks. Buffett was right; it’s a weighing machine but

weighing machines don’t have calendars on them. The timing will be a guess on when they

become popular.

We hated to cancel the Holiday Party. The prospect of minus 40 degrees wind chill was too

much for us to ignore. If any of our clients had been injured because of this, we would have a

hard time forgiving ourselves. Three inches of snow we can ignore. Possibly dying in freezing

wind chills, we could not. You will receive a gift in the new year as our thank-you for hanging in

there with us this year.

Sincerely,

Mark Brueggemann IAR Kelly Smith IAR Brandon Robinson IAR

An Active Quarter

There are a lot of quarters where there isn’t much happening in the world to talk about. This is not one of them. We have a war in Europe, oil over $100, wheat and corn prices at decade highs, the NASDAQ dropping 20% to name a few things that have happened this year. Let’s talk about it.

There is a joke in our office that when Mark leaves town crazy things happen. Mark was in Nicaragua when Brexit occurred. The markets were down almost 10% on that news. To celebrate his 30-year wedding anniversary in 2011 he went to London where riots broke out and the markets were down again by over 10%. In 1990 he was in Disneyland when Saddam invaded Kuwait. This time he was in Florida on a four-day vacation when Putin invaded the Ukraine. The obvious solution to this problem is to cancel all of Mark’s vacations and keep him at work. We will let you know how that goes.

When the war broke out on February 24 th , it was assumed by most pundits that Russia would roll over Ukraine in 72 hours. It was a forgone conclusion that it would happen. As we type this letter on the last week of March, that assumption has proven to be a bad one by the media and Putin. This war has changed the economic outlook of just about every country in the world. It’s not for the better.

Russia and Ukraine export around 25% (source NY times) of the world’s wheat production. They are also key suppliers of barley, corn and sunflower seed oil. To make matters worse, Russia and Belarus are the second and third largest potash (used to fertilize crops) exporters. They also are accountable for 17% of the world’s nitrogen used for farming. The sanctions placed on the banks and the exporters of Russia make it very difficult to gauge how much food or fertilizer is going to be shipped. If you want to get a letter of credit to buy anything from Russia, it will be very difficult. Even if the bank sanctions exclude food or fertilizers in the future, it’s doubtful you are going to get what you want from them if the banks are afraid to finance them. As we type this, we are under the assumption that the price of food will go much higher than the consensus thinks today. Why?

We have written about how cheap commodities are for about five years. We have also written when you print as much money as the world has it eventually ends up in “stuff” like commodities. This war lit the match on that money. Russia’s GDP is estimated at $1.4 trillion which is about 2% of the worlds GDP. If you think about it, that seems out of whack with reality. That GDP is way too low for what they produce. We own Apple’s stock and its market cap (GDP in this example) is $3 trillion. In our way of thinking about things, Apple is valued more than Russia. We own Apple and are big fans of it. However, if we must choose between food versus an I phone we will choose food. Russia is valued at 2% of the worlds GDP but it accounts for about 25% of its food production. This is a crazy mismatch in valuations. Same goes with Latin America. They produce lots of “stuff” and their stock markets have been horrible for eight years. Why? Investors wanted tech over “stuff” and took for granted the food and energy we consume. Today Latin America stocks are the number one markets in the world in 2022. Stuff is back.

We are not advocating investing in Russia. What we are advocating is invest in areas of the world where Russia’s problems are somebody else’s gains. We did not see this war coming five years ago when we started writing about inflation. We are positioned to benefit from it, due to our view that energy and food are too cheap versus the other things we consume. This war will expose the weakness of the food supply chain. Let’s talk about oil.

We own oil stocks. They have been good to us so far. The world consumes about 100 million barrels of oil a day. It produces about the same. Russia produces around 10 million barrels of oil a day of which they export 7 million of it to the rest of the world. If the world stops buying Russian oil because of sanctions, you have removed 7% of the world’s oil exports in just one month. You can’t replace that quickly if ever (we vote never). When the markets saw the potential for Russian oil to not “circulate” they bid up the price of oil to over a $100 a barrel. At some point prices will go high enough that you will get demand destruction and the world won’t consume 100 million barrels a day but less. How high does oil have to go for that to occur?

As you can see from the chart, oil consumption as a percentage of American consumer’s paychecks are not near historical highs. It’s not close. What this tells us is that oil is going higher than it is now to get our consumers to change their behavior and consume less oil. The average percent that a consumer has spent on oil in the last 60 years is 4.82% of their income. Today we are spending about 3.8%. If you try and guess what the price oil would be to get to the average of 4.82%, we think it is over $130 a barrel. If oil went to some of the spike highs, we have had in the past oil could get to around $200. At a time when we are having a major supply shock from Russia, we are also having impediments to drilling imposed in the USA from our government. We also have clean-energy advocates pushing the large oil companies to not drill for oil anywhere in the world. This is going to make it very difficult to increase oil production in the states. It’s our best guess that oil production here heads south and doesn’t come back to the previous highs of 13.2m barrels a day (we are at 11.6 today). We have had a 20-year low in drilling in the US for the last 2 years. We don’t see that changing anytime soon. When you add all of this up, we think oil over $130 is a good bet. As of this writing we have not sold any of our oil holdings.

To give you another way to size up commodities versus stocks, we keep track of the ratio of commodities and oil to the stock market. In the last 35 years the ratio of the S&P 500 index price divided by the price of a barrel of oil is around 25. Today that ratio is at 43 (S&P 500 4600/$107 Oil). Based on this ratio, stock prices are still 70% above their statistical average versus a barrel of oil. If the S&P was to stay at 4600 the ratio would be at its normal range of 25 if oil went to $184. Again, the most likely scenario is oil goes up. Of course, stocks could tank to 2675 and put the ratio at 25 when oil is $107. Our best guess today is oil goes up rather than the S&P goes down. You can also use this ratio for a basket of commodities. A basket of commodities usually represents about 15% of the S&P 500. Today that number is 7%. Again, the message is the same. Commodities are still undervalued versus equities.

The yield curve is worrying investors. What’s a yield curve? The yield curve is the difference between two maturities of treasury bonds. Most investors use the spread between the 30-year treasury bond and the 3-month T-bill. Other use the 2-years to 5-year spread. Some use the 2 to 10. As the difference between these two maturities narrow economists believe it helps predict a recession. If the spread is widening it predicts an increase in economic activity.


The spread above is the difference between 2-year treasuries and 10-year treasuries. As you can see the spread is now basically zero. The market is anticipating a dramatic slowing down of the economy. We think that the economy will slow down but not enter a recession. The yield curve can be narrow or inverted for quite a while before the economy finally gives up and heads south. We wanted to show you this chart just to let you know that the markets are worried about. We hope they are way early.

As always if you have any questions give us a call at 417-882-5746.


Sincerely,


Mark Brueggemann IAR Kelly Smith IAR Brandon Robinson IAR

Bad Breadth

We had a very good year in 2021. The markets continue to snap back from the COVID induced bear markets of 2020. Over the last three years our model account is up 30.36%, 20.39% and now 33.3% this year. As you know, those returns have not been linear. It’s not been a smooth ride. We are 100% convinced it won’t be a smooth ride over the next three years. Here are some of our thoughts about what might be next.

We have been big believers in inflation coming back. We wrote about that in our last letter so we don’t have a lot of new things to add. We do want to point out the chart below. We don’t think inflation is transitory as the Federal Reserve initially thought. The chart below points out how big a surge we have had in inflation this year. At our holiday party we noticed that lots of our clients were talking about inflation. This is new and worth noting. The Fed has doubled it’s balance sheet in the last 18 months. If that money starts to circulate through bank loans and housing speculation, we might see some big inflation numbers in the next two years.

When inflation kicks in, interest rates tend to rise. We are shocked that we just reported a 6% inflation rate and the 10-year government bond is yielding only 1.5%. We have not been government bond buyers for our clients in the last 10 years. We still don’t get why owning bonds are a better bet financially than owning stocks or commodities. We reserve the right to change our mind, but when you have inflation at 6%, short-term rates should be way higher than zero. Something has got to give. You can’t expect savers to have a net return of minus 6% after inflation and accept that forever.

We talk a lot about the markets in these letters because they are an area of intense interest to most investors. We want to elaborate a little more on that subject to discuss how we view owning individual stocks versus owning the broad markets (S&P 500, Russell 2000, etc). We view the stocks that we own as if they were corporate bonds. We think it’s easier to value an individual stock that way than it is to value the entire market. We then compare each individual stock to all the asset classes out there (particularly bonds and oil). How do you “make” a stock a bond for analysis purposes? The cash flow that a company earns may or may not be paid out to shareholders through dividends, but its there for the company to decide what to do with. It belongs to the shareholder whether they pay the cash out as a dividend or not. As an example, Lumen has over $3 billion of free cash flow this year. They paid out $1 billion of that money in dividends while also buying back $1 billion in stock. That left them with over a billion bucks to pay down debt. As we type this, the company’s stock is valued at $13 billion. If you take the $3 billion of free cash flow that Lumen produces and divide it by the total value of the stock you get a 23% yield if they paid it all out in a dividend. By doing that you can start the process of comparing a stock to a bond. If you did that with BGC Partners the yield would be 11%. With Berkshire it is around 10%. When you have those types of valuations with interest rates at zero or 1.5% on a 10-year bond, it makes it easier to decide what to own. The risk with owning stocks is that you get the cash flow estimates wrong. If Lumen only had free cash flow of $2 billion, the stock would still be cheap, but it would start to lose its margin of safety. Hence, you want something that pays way above the bond rate to compensate for the uncertainty of owning that stock. You must get the cash flow right over time or the investment is a mistake.

Our two best performing stocks over the last three years have been Tesla and Apple. As those stocks went up a lot, we started paring back the positions. Today the bond equivalent yield on Tesla is 1%. With Apple it’s about 4%. We think the markets “yield” is around 3%. When we first bought Apple’s stock, the yield the way we calculate it was 23%. In 2013 there were a lot of concerns about how viable Apple’s cash flow was going to be. Today there is not. As Apple’s or Tesla’s stock went up, our margin of safety went down, hence we sold some. We continue to hold those stocks in most of our accounts. If Apple and Tesla continue to grow earnings over the next five years, their stocks will do well, but that’s not a certainty. If they don’t, then we have to worry about what interest rates are doing when we compare the stock “bond” yield to the actual 10 year bond rate.

The S&P 500 made new highs in December. Why do some investors worry about breadth? What’s breadth? The S&P 500 is a market cap weighted index. Market cap simply means that Apple’s $3 trillion stock valuation (market cap) dwarfs the 500 th stock’s market cap in that index. Apple represents 6.927% of the index while Under Armour’s stock (number 500 in the index) represents .0086% of the index. If Under Armour’s stock was to go up 10 times in value next week while Apple’s stock only declined around 12%, the effect would be the same on the index. The S&P would be flat. What happens to Apple is more important than anything that happens to Under Armour by a large factor. We want to highlight that phenomenon by showing you two charts. The first chart is the S&P 500. Notice how it has been above its 200-day moving average all year. The second chart is the number of stocks that are in the S&P 500 that are above their 200-day moving average. As you can see, most stocks in the S+P 500 were above their moving averages until June. Now the majority are below it. You can’t tell that the market is “churning” from looking at the S&P chart because it is comfortably above its 200 day average. The reason for the divergence is that stocks like Apple/Google/Microsoft are still trending up and what they do dwarfs the bottom 450 of the S&P 500. This is what the stock market pundits mean by bad “breadth”. Only a few stocks are going up and the rest are not.

We point out these divergences to remind people that the indexes are a great way to see how the markets are doing. That said, because the S&P 500 is influenced by the largest stocks in the group, it can cause for a lot of distortion. Our last chart is of the Value Line composite. This chart does away with market caps and values ever stock as equal. The move in the smallest stock is equal to what Apple’s stock is doing. That index is up only 16% since the first quarter of 2018. If you were throwing a dart at a list of all of the stocks in the United States, this is what you would have most likely made. What is great for us is this is the group we are looking at. If they haven’t gone anywhere in three years, but their earnings have, this make us interested. We hope to find some new ones soon.

Our last stock purchase for clients this quarter was Transocean Drilling (Rig). This stock is a bet that fracking slows down in the U.S. and oil drilling moves offshore. We kept the size of the position to around 1% of your portfolios because this stock has more risk that our usual ones. Rig’s earnings are very sensitive to the price of oil. They price their offshore platforms to customers on what is called a day rate. This rate fluctuates a lot. If oil prices continue to climb, so will this rate. Most of the offshore drilling industry has been in severe financial distress. The largest of the drillers just emerged from bankruptcy. The industry is consolidating. We think there is a good chance Rig and the industry will have pricing power if oil prices stay where they are. If they go up, we should have fun owning this. If prices go down, so will their earnings and we hope we get consolidated. We don’t have as much earnings backing this stock up as we would like, so we kept the position small for now. We will keep you updated

Sincerely,

Mark Brueggemann IAR Kelly Smith IAR Brandon Robinson IAR

Oil goes up.

Volatility in the stock market has begun to pick up this quarter from a very low base. We want

to talk about some of the things that have investors nervous right now.

We have been predicting for the last few years that we are headed for much higher energy and

commodity prices. The chart below represents what a basket of commodities has done since

2007.

As you can see, commodities as a group are at five-year highs. You can also see that they are

still down over 50% from their 2008 highs. Are we going to challenge the old highs? We think

there is a chance we might. Let us elaborate.

Oil and all its derivatives represent about 33% of this index. Oil prices have been in a bear

market for about seven years now. We think that trend has ended, and prices are headed

higher. Why? In 2013 when a barrel of oil was over $100, we had over 1,900 rigs drilling for oil

in the United States. When oil was close to $150 a barrel in 2008, we had over 2,000 rigs drilling

for oil. Today we are at 500 rigs drilling, which is up from the low of 250 last year. We are at

very depressed levels for oil drilling.

In 2011 the U.S. produced only 5 million barrels of oil a day. At its peak in 2020 we produced

13.2 million barrels a day. Today we are producing about 11 million barrels a day. Almost all the

gains in U.S. production came from fracking. We have written in the past that we think fracking

for oil is a poor business model. Fifty percent of the oil produced from a fracked well is in year

one and then it declines dramatically. You are constantly having to drill more and more wells to

stay even in oil production. You are NOT finding large pools of oil with fracking. You are taking marginal wells

and trying to “squeeze” a few more drops of oil out of it before you move on to the next well.

The world consumes about 100 million barrels of oil a day. It is projected that the world will

need around 120 million barrels of oil produced a day to satisfy world demand in the next 20

years. Very few (not us) saw oil production in the U.S. growing by 8 million barrels over the last

10 years to cause an oil glut in the world markets. The U.S. has been the only area of the world

that has grown production by any meaningful amount over the last decade.

The environmental, social and governance movement (ESG) has targeted oil companies as evil.

They were able to get seats on the Exxon board while only owning 1% of the stock. The Exxon

board then announced they were reducing the amount of money they spend on oil and gas

exploration. The ESG movement has helped restricted the flow of capital to any energy

producing company that isn’t in the wind or solar business. This is going to cause a real problem

soon in the energy markets.

Wind and solar (ESG favorites), according to the Energy Information Administration (eia.gov),

produced 3% of the energy consumed in the United States as of 2019. Oil and natural gas

represent 69%. By restricting capital to the oil and gas business, we are taking a huge leap of

faith that we won’t have oil and gas shortages soon. The ESG movement is assuming we can

replace that lost production with wind and solar. We see no way that happens over the next 5

or even 10 years. What is concerning to us is the next two years. As the world economy

recovers from covid, we don’t think there is going to be enough oil to go around. The record

lows in oil rigs drilling will start to show up in less production in the U.S. It is our guess that once

oil produced in the U.S. goes below 9 million barrels a day, oil will be at least $100 a barrel. We

are not sure how our politicians are going to react to this. Will they tell you to turn down your

thermostats this winter to ease the crunch? Will they tell the environmentalists to have some

patience with moving from 3% wind and solar production to 10% over the next 10 years? Will

they blame the oil companies for restricting drilling and causing a shortage? Will the EPA ease

up on methane restrictions and clean-air zones? Will the government make it easier to build

solar and wind farms by easing the restrictions on government permitting (stop not in my

backyard protests)? We don’t know the answers to these questions today but we are going to

find out soon.

Eighteen months ago we had around 900 rigs drilling for oil, which in our opinion was not going

to keep us at 13 million barrels a day produced in the United States. With the rig count

averaging 400 rigs drilling for the last 12 months, time is ticking for a potential energy shortage

to occur. Please remember that around 50% of a fracked well’s production occurs in year one.

The shortages should start to show up in Q4 of this year due to a lack of new rigs looking for oil.

So what do you do about this? We own oil stocks, gold stocks, Latin American stocks, real estate

stocks and oil trading companies, to name a few. To hedge our bets, we continue to have a very large position

in Tesla. Electric cars are the way of the future as is power storage and solar

panels. Tesla should do well in that environment. Electric cars won’t be able to move the needle

quick enough to change the supply demand imbalance we see coming. Relatives and employees

of Trend Management own five Teslas. We love the product but it’s not going to help us out of

this mess soon.

If we are right on our oil prediction it will cause our balance of payments in world trade to get

worse for the U.S. This will cause the dollar to go lower, which will cause other commodities to

go higher (wheat, corn etc). It will be a negative feedback loop that will be hard to stop in the

short-term.

When oil prices rallied in 2000 it marked the end of the dot-com bubble. During that time

frame, value stocks did very well and dot-com stocks dropped over 50%. We owned value

stocks then and we do now. We think something similar could happen in 2021-22 though not to

the extremes like 2000. Higher inflation and commodities will “suck” money out of the QQQ

index and push it into value. Will it be the same? Nope. Will it look familiar? Yes, we think so.

This letter may seem a little depressing talking about oil shortages and rising prices. It may

never happen. It’s our job to invest based on what we believe is going to happen for a company

as well as on a macro basis. So far this year oil prices are up over 50% and we are having a good

year. We think that can continue. We think, for growth stocks, this market is going to be much

more difficult based on what we wrote above.

We think the world has become overly complacent about inflation. The next 18 months will test

that complacency. We haven’t bought a government bond for clients in over 13 years. Maybe

we do that at the end of this cycle. We are predicting a problem and we have invested

accordingly. We hope we are right. Feel free to call us at 417-882-5746 to discuss it.

Our holiday party is back on this year. We will have it at Highland Springs from 6 to 8 on

December 23 rd . You will receive and invite in the mail after Thanksgiving. We look forward to

seeing everyone in person again.

Sincerely,

Mark Brueggemann IAR Kelly Smith IAR Brandon Robinson IAR

Lets Talk Stocks

It has been a good year so far for our investments. We will spend this letter talking about a few

of our holdings that have news this year that we think matters. We will also mention a couple

of thoughts on inflation.

We will start with Newmark Group, a nationwide real-estate services company. Newmark is a

spin-off from BGC partners. In the spin-off, Newmark was granted around 6.2 million shares of

Nasdaq stock that BGC received in 2013 for selling Espeed to Nasdaq corporation (BGC

originally got around 15 million shares in the deal). Each year they were allowed to sell around

a million shares of the stock but no more. This meant that Newmark still had to wait six years

before they were totally out of this investment unless there was a corporate event at Nasdaq.

Guess what, there was one. Nasdaq decided to get out of their Espeed investment and sell it to

Tradeweb. This event (assuming it passes regulatory approval later this year) triggered the

automatic vesting of Newmark’s remaining 6.2 million shares of Nasdaq stock. At the time of

the announcement the value of Newmark’s Nasdaq stock holdings was $868 million. The total

market cap of Newmark at the time of the announcement was ONLY $2.2 billion. This meant

that should the deal go through (we think it will), Newmark’s cash position from the sale of this

stock was going to represent 40% of the total value of Newmark’s market valuation. We

thought that was great news for the company and we bought more stock for clients at $8.

Today it is trading at $12.50, which is up 56% from when the news was announced. A happy

side note to this deal is that the value of the Nasdaq stock Newmark owns has gone up another

$248 million since February (it’s now worth $1.16 billion to Newmark shareholders). Newmark

will have a lot of cash to work with soon and we are expecting a big stock buyback from them.

We still believe Newmark’s stock is very undervalued at $12.50.

BGC Partners also had some good news this quarter. Over the last three years BGC has invested

(our estimate) around $200 million in developing a new insurance brokerage business inside

BGC Partners. The up-front expense of doing this new venture has hurt earnings, which has in

return hurt the price of BGC’s stock. This quarter they announced they are going to sell this

investment for $500 million. In the last quarter this division lost 400 thousand dollars. The sale

of this investment will improve earnings. We think they got a good price. It is the company’s

guess that the internal rate of return on that 200 million investment is around 25 to 30% per

year. BGC’s reward for this good investment was a stock that is trading lower than it was in

2018. The 500 million dollars they will receive works out to about 15% of the market value of

BGC’s stock at today’s prices ($5.7). We think they will take that money and buy back their

stock with it. The company’s main business of electronic brokerage continues to do EXTREMELY

well. We think a fair value for BGC is over 10 bucks a share.

Lumen’s stock price is still very undervalued. At the beginning of the year the stock was trading

at $9.75 a share. At that price, the investment was trading for a little over three times free cash

flow ($3 a share in free cash flow). This means that in three years, assuming no change in our

free cash flow estimate, you will receive all your money back either in dividends or the

company paying down its debt. This is a fantastic return in a world at zero interest rates. This

quarter the company “hinted” that they are considering buying back their stock instead of

paying down debt. We think this is highly likely to occur. We think they will continue to pay out

a dollar a share in dividends (a 7% yield at today’s prices) while we wait. The logic in buying

back stock is simple math. They are borrowing at a 4% to 5% interest rates. Their stock is

yielding 7%. You can increase your free cash flow by keeping their existing debt at these low

rates and buying back your stock, which is yielding a higher rate. We think this logic makes

sense until the stock is well above $20. Our best guess is they will announce a billion-dollar

share buyback this year. With the stock currently valued at $14 billion this will be well received.

We expect revenue comparisons to improve significantly starting in q3 this year. Let’s hope

they buy back the stock before then.

Berkshire Hathaway continues to roll along. The stock made new all-time highs this quarter. We

think the stock continues to trade at a discount to what its worth because of the ages of

Warren Buffett (91) and Charlie Munger (97). Last quarter Berkshire bought back around $7

billion of their stock. They have around $150 billion in cash sitting on their balance sheet.

Should one of the two founders pass away, the company has ample liquidity to buy back their

stock should they wish to do so. We think they will buy it back. We hope they live to see the

next decade. They are still very sharp when you hear them talk. That said, we think the discount

this stock trades at versus the market is not warranted. We think it should trade well over $300

dollars a share (it is $275 today).

For about four years now we have been talking about how inflation will be coming back with a

vengeance. Well, it’s here. Have you tried to buy a house lately? How about a car? How about a

“number one” at your local fast-food restaurant? If you have, you will notice that prices are up

a lot. The CPI index is up 5% year over year. PCE index is up over 3.6%. Meanwhile treasury bills

are trading at basically zero. This makes no sense to us. The money supply was up over 25%

year over year. This is the highest reading we have ever seen in the United States. The Federal

Reserve continues to say this inflation scare is transitory. We don’t think so. As we have written

before, the trade wars are going to continue to push prices higher. You will not be able to

outsource manufacturing from the US to the rest of the world as easily as you could the last 30

years. Free trade and capital flows are going the wrong way if you are betting on deflation. Our

governmental leaders have zero respect for budget deficits. We have record retail demand, but

we don’t have record employment to satisfy this demand. These are relatively new or

accelerating problems that will only get worse with time. We have invested money in value

stocks, gold, steel, oil and Latin American stocks to profit from inflation. We do not think this

mess will be solved easily. Until the dollar goes to new four-year lows or oil hits a $100 a barrel,

the Fed can continue to say this is transitory. Once those two things occur (we have bet they

will), life will be more difficult for all of us financially. We have planned to profit from inflation

and so far, we have. The markets will be more difficult once (some say if) the Fed decides this

inflation scare is not temporary. We hope to adjust to what the markets serve up.

Sincerely

Mark Brueggemann IAR Kelly Smith IAR Brandon Robinson IAR

Value is Back

The financial markets are starting to sense we might be heading into a bout of inflation. This has helped out our accounts this quarter. We have written about how value stocks have suffered the last five years versus growth stocks. Let us talk about it just a little more.

Over the last 12 years the proxy most investors use for new economy stocks or growth stocks is the Nasdaq QQQ. It is a basket of 100 stocks that do not include old school energy and bank stocks. If you take the previous highs in these indexes from the last bull market in 2007 (before the financial crisis) and see how they have done going into this quarter, you will see that the QQQ is up 532%, financial stocks are up 11% and energy stocks are down 41%. New tech has been the place to be for the last decade.

During this 14-year time frame the 10-year-treasury bond interest rate has dropped from around 5% to almost 50 basis points (half of one percent). The reason we mention the decline in interest rates is to point out how the financial markets over this last decade have not been concerned about inflation or that GDP growth will be that great. For the most part the bond market got it right. Why does this matter when talking about growth versus value stocks?

The answer is that value stocks have earnings and so many growth stocks do not. Last year a basket of money-losing growth stocks were up over 100 percent. It seemed like the more you lost the better your stock price did. When interest rates are very low and declining, cash flow and earnings don’t matter as much in a discounted cash-flow model compared to PROJECTED earnings growth rates. Wall Street/Silicon Valley seized on this fact and ran with it. Silicon Valley, with the help of Softbank’s billions in venture capital, drove up the value of virtually every money-losing good idea an inventor had.

Whether you lost money was not important. Money is free. Just promise that in 2030 you will finally make money. If interest rates stay very low, the losses you have today don’t matter as much as the gain you promise 10 years from now.

In the last six months interest rates on the 10-year treasury have started to go back up from around 60 basis points to 175 basis points. Since that time the QQQ is up 17 percent. Financial stocks are up 44%. Energy stocks are up 75%. As rates have gone up, the market bid up stocks that have cheap valuations versus stocks that expect rapid growth. If rates continue to go up as we expect, this trend will continue.

To a lot of investors, basing your long-term buy decisions based on the shape of the yield curve today seems crazy. We can appreciate that thinking. That said, we do not write the rules on Wall Street, we just try and profit from them.

We own a lot of large money-center bank stocks, energy stocks and Berkshire Hathaway which is a combination of all the above. If rates continue to rise on the long end of the yield curve, it indicates growth is coming. In that scenario our accounts should continue to outperform growth stocks and the indexes. Why might rates go higher?

The new stimulus bill of $1.9 trillion (not the old trillion-dollar stimulus bill of 2020) is just a staggering number to comprehend. None of this stimulus money is paid for by higher taxes, and we doubt it will be. Around half of the states will have higher tax revenue in 2020 than they did in 2019, despite COVID and yet we are going to throw another $1.9 trillion of stimulus on top of that in 2021. Our leaders are also talking about a 3-trillion-dollar infrastructure bill later this year. At a time when the tax revenues of the states indicate “the patient” is stable, we are going to shoot him up with Narcan, electric paddles and hot water. This economy is going to be crazy hot over the next few years (absent COVID 2.0).

The CRB index of commodities is up over 50 percent since their lows last year. We think that trend will continue. We think food and energy prices will lead the way. At some point in this cycle our Federal Reserve will be forced to choose between funding the federal government’s budget deficits or letting inflation take off. We think they will choose the latter. If you own long-term bonds, you are going to get killed if this scenario plays out. Since August of last year a basket of 10 and 30-year bonds are down 21%. At some point investors will become less complacent about this than they have been so far if rates continue to rise.

There is an old rule of thumb that the price-earnings multiple of the S&P should be 20 minus the inflation rate. With inflation at 2% today that would put the multiple at 18. If you use todays trailing 12- month earnings for the S&P 500, todays PE multiple is around 40. One can argue that those earnings are depressed by COVID and you would be right. That said, the margin for error is narrow. What is in our favor as value investors is that the large stocks with the highest PE multiples are tech stocks. They have driven this multiple up the most. We own two of those, Tesla and Apple. We have also cut back our positions on both of those in the last 12 months. We know they have been great performers for us but we think they are going to have the wind in their face for a while. In a low inflation world Wall Street will pay up for growth. In a rising inflation world, they will not.

One of our leading stocks this quarter is Nucor steel. It is up over 50% year to date. Nucor owns a recycling operation that will benefit when metals prices go up. It also helps that they are the leading steel producer in the USA. They would be a beneficiary of a new infrastructure bill should it occur. It is a strange sight compared to the last 10 years for a steel stock to be beating the tech stocks. We hope that continues with Nucor.

Our last thought has to do with the economy. Before the last stimulus bill, consumer disposable income was at 50-year highs. This number will only go up as people receive more money this month. The Fed and our government have flooded the economy with money. Most everyone will have a vaccine by June 1. This is going to set the stage for some crazy retail-sales numbers in the US this year. We hope to figure out other ways to profit from this pile up of money. If you have any thoughts on this give us a call

at 417-882-5746.

Sincerely

Mark Brueggemann IAR Kelly Smith IAR Brandon Robinson IAR

2020 Year End Report

This will be a year few of us will forget. We had record lows in interest rates, a record

decline in stock prices followed by a record rally in stock prices, new highs in bitcoin and

gold, negative oil prices coupled with 9 months of quarantines. Let’s talk about what

might be next.

World stock markets declined about 40% in 30 days when COVID-19 lockdowns started

in February. This was the fastest decline from their highs in history. Following that low,

stocks recovered and went to new highs. The rally was selective in that large-cap tech

stocks did well while most of the real economy stocks did not. Apparently in lockdown

we only need I-Phones, Netflix and electric cars. The biggest winners in our accounts

were Apple and Tesla’s stock. Tesla went up over 700% and Apple was up 75% this year.

These two stocks carried our accounts. The market for our value stocks picked up in the

fourth quarter and we think that will continue. That said, they continue to lag the

market averages this year. Someday earnings and cash flow (which value stocks are

judged on) will matter more than companies that generate revenue growth with little

profit. A resurgence in value stocks started in November, but it’s too early to say if that

trend is now a secular shift as it was back in 2003 and 2009.

We have stayed fully invested in this market until we took partial profits in Apple and

Tesla last quarter. We will be potentially reinvesting part of that money in large-bank

stocks as a “play” on rising interest rates. Bank stocks are still cheap and “hated.” We

continue to look at oil stocks that we mentioned in our last report. We are anticipating

more production cuts in U.S. oil produced. As of this writing, production is only down 2

million barrels a day from its peak (13.1 million barrels a day) and we think that decline

will increase. Same goes for COVID-19 restrictions easing up. The world is still in

lockdown, and it’s a factor in decreasing energy consumption (transportation is 20% of

oil consumption). The vaccines are here, which we think will be great for economic

growth in Q2. Our government also approved another trillion-dollar stimulus plan that

will go out in Q1. We think the fooler for 2021 is how strong the economy could be by

year-end. Consumer balance sheets for the most part are in good shape. People want

out of the house and we think it could be a lot of fun by summer. As the economy

recovers, so will oil use.

Screen Shot 2021-01-20 at 11.05.26 AM.png

We want to point out with the chart below the rapid growth of money in circulation. As

you can see the increase in M2 is way larger than anything we have seen for the past 20

years. As we have written before, this money has to go somewhere. We don’t see it

staying in financial assets forever.

Screen Shot 2021-01-20 at 11.06.28 AM.png

As we noted in our Q1 report, the Federal Reserve has free rein to print all the money it

wants until inflation comes back (see chart above). Right now the Fed is printing $120

billion a month. This seems excessive to us. Most of that money has been going into

large-cap growth stocks (tech), gold and bitcoin. When (some say if) inflation comes

back, the Fed will start pulling that money out. When they do, this won’t be taken well

by the stock or bond markets. Our desire to own oil stocks is a bet that when they do

well, the general market will not. As much as we love the green movement, it will be

decades before we replace oil in our everyday lives. Solar and wind power represented

3% of the energy produced in this country in 2019. Renewables as a group are at 11%.

Inside renewables are wood burning, biofuels, geothermal and hydroelectric. We don’t

see those growing enough to replace oil and natural gas. The valuations for these stocks

are very low. We continue to watch them.

We want to finish up this letter by talking about large macro trends. We do not believe

the changes in the presidency or Congress will change Trump’s anti-trade policies. The

names are going to change but we don’t think their actions will. In December, the dollar

made a two year low versus other major currencies. We believe that trend is just getting

started. Our irresponsible fiscal and monetary policies are going to continue. We are

going to have large trade and budget deficits. Eventually these factors effect our

currency in a negative way. When the dollar initially declines, it is viewed positively by

U.S. investors because American companies gain an advantage over foreign companies.

Over time this view changes to one of concern about the value of their money. In 2008,

the dollar made all-time lows while oil was trading at $150 a barrel. The dollar making

new lows was part of the reason for oil going up. Gas at the pump was $4, which helped

push us into a recession. When the dollar goes lower, oil prices tend to go higher, which

is what we witnessed in 2008.

When an inventor in the United States came up with a new widget for sale in 2008, he

outsourced the production to China. With restrictions in free trade continuing, we think

in 2021 outsourcing will be more difficult. We do not see the Chinese supply chain

HOLDING down prices as much as they did in the past. There will be less competition

from them as we continue to restrict U.S. companies from doing business there. This will

have the effect of raising prices at the same time our currency is declining. This is not a

great combination for easing monetary policy. We think this scenario is the most likely

one to occur over the next five years, and it guides our view on what companies to own.

If you have a different view, let us know.

Thanks for your support this year. We hope you have a great year in 2021 as we finally

put COVID-19 behind us.

If you would like a copy of our ADV II or privacy policy contact us at 417-882-5746.

Sincerely

Mark Brueggemann IAR Kelly Smith IAR Brandon Robinson IAR

We Sold Some Stock

The equity markets continue to be very volatile as the world tries to sort out the long-term effects of the pandemic. As we write this letter the stock markets we follow have just entered their second correction this year. The Nasdaq 100 is down 14% in September and the S&P 500 is down 10%. In the first quarter the S&P 500 ultimately dropped 36% in about six weeks. It then rallied over 60% in the next five months. If it feels like you are on a financial roller coaster, it’s because you are.

We have been keeping an eye on the implied option volatility estimates for the S&P 500 going into the election. The option premiums are extremely high. This means that the market makers are anticipating a lot of big swings in both directions over the next five weeks until the election is over. We hope to take advantage of those should the swings be to the downside.

Our opinion continues to be that the stock markets of the world will offer better value than bonds or cash for the foreseeable future. We think this trend will hold until inflation comes back. At that point, we think cash, value stocks and commodities will be better investments than a basket of stock indexes. When does inflation come back?

This quarter lumber prices went to new 10-year highs. If you are wanting to build a house, we are sure you might have noticed. Copper prices are at two-year highs above $3 a pound. Soybean prices are at their highest level in 2.5 years. Wheat prices are at 5-year highs. Gold reached a record high in all currencies this quarter. These prices indicate inflation may be nearer than we think. What is holding inflation back in a big way is that the oil markets are still suffering from COVID. According to the U.S. Energy Information Administration, transportation represents 28% of the end users who consume energy. Inside that segment we have two sectors that are really struggling: airlines, which consume jet fuel; and diesel trucks, which ship goods on our highways. When those sectors come back (we think in mid-2021), we think so will inflation concerns.

Passenger boarding’s on U.S. flights are down about 70% this quarter. Jet fuel is a big use of oil. We don’t see that trend getting materially better until a vaccine comes out. We are surprised at the decline in diesel fuel consumed by the trucking industry. These numbers are hard to get, but our best estimate is demand for diesel fuel is down 40% from a year ago. We expect this group to come back quicker than the airlines. If we miss on that estimate, it will be later rather than earlier. Watch these two groups for a sign that inflation is coming back.

The U.S. Federal Reserve came out this month and said, we are OK if inflation goes above 2% for a long period of time. The Fed also said they will not worry about how much money they print to accomplish this goal. This is the exact opposite of what Paul Volcker did to stop inflation in 1979. Over the next 12 months, the Federal Reserve is going to print 20% more money to put into circulation. Over the last 12 years, that money printing has ended up in the stock market. We have talked about this phenomenon a lot in past letters, so we won’t elaborate on it in this time. As we stated in April, we think that the money the Fed prints will end up in stocks. We continue to feel that way until the oil market comes back. Once it does, we think that dynamic will change and not be as friendly to financial assets. As we stated above, watch the oil market for signs the economy is overheating.

For most of our accounts, we sold part of your Apple and Tesla stock this quarter. We did that to get those positions down to around 8% of the value of your accounts. For those whom we initially bought Apple in 2013, we ended up making about 6 times our money (not counting dividends). On Tesla it would be around 5 times. We still have large positions in these stocks. We continue to think there is upside in both but felt they were too large a percentage of our accounts assets.

What are we going to do with that cash? Some of it will be allocated to oil stock investments. This is a sector that is universally hated. In 1980 it represented over 30% of the market capitalization of all stocks. Today it is at 2%. We think the market has this wrong, and we will bet accordingly if we get our price. It might seem strange to own a renewable energy stock in Tesla while buying oil stocks. The irony is not lost on us. We will keep you updated on what we do.

We have also become more intrigued with the carnage in retailing. Except for the big box stores like Walmart or Home Depot, this sector is priced as if nothing will ever go right again. We do think there are some winners here that will survive the assault of online sales and COVID. If we buy anything in this area, we will talk about it in our next letter.

CenturyLink has changed their name to Lumen Technologies. The new ticker symbol is LUMN. They did this because they feel they are a technology company more than they are a traditional telecom company. There was no change in the number of shares you own or the structure of the company.

On a sad note, we will not be having the Christmas party this year. We do not want anyone to take a risk this year with their health to see us. We also do not see how a buffet can be served this year (health authorities are discouraging them) to accommodate over 100 people in a two- hour time frame. Make sure your address with us is correct. You will be getting something in the mail.

Sincerely

Mark Brueggemann IAR Kelly Smith IAR Brandon Robinson IAR

July 2020

We wrote this in our last letter, “We believe the pattern of money printing and rising financial assets is not broken. We think within 18 months the markets (and our accounts) will be trying to make new highs. We understand this view is a minority one after a decline of this magnitude. The playbook of the last 12 years is being put to the test. We think it’s still valid.” We wrote that when the S&P 500 was at 2300. Today it is at 3060. We are off to a good start in regaining what we lost in Q1. The market is still very volatile right now. It has big swings daily on every new COVID related development. The gains in the market since the lows are very skewed to a certain sector of the market, which is what we will talk about next.

Screen Shot 2020-07-20 at 11.38.55 PM.png

There are times when the market picks a group of stocks or a style of investing and rewards it with higher stock prices. We have written in past letters about how this market reminds us of the dot-Com bubble of 1999-2000. The chart above shows you visually how that played out. When we wrote in our last letter that the Federal Reserve printing money was going to raise asset prices, we were surprised how quick the markets responded to that money printing. There is usually a lag time of months between when they print the money and you see it in rising asset prices. This time the $3 trillion dollars (it will be more) they printed showed up in stocks in just a few weeks. Most stock indexes bottomed on March 23 rd which was just two weeks after the Fed threw trillions at fixing the economy. Large capitalization tech companies that trade in an ETF called the QQQ were the first stock index to move up. When the Fed was concerned about Y2K in 1999, they also printed a lot of money that ended up in the QQQ at the height of the dot-Com bubble.

The QQQ index includes 100 of the largest domestic and international nonfinancial companies listed on the NASDAQ Stock Market based on market capitalization. Take note: This index does not own any financial or oil stocks. Tech stocks represent 67% of the QQQ. Consumer discretionary and health care represent 23% of the index. Fully 90% of the index is less effected by the economy and COVID than most companies.

When the money printing started in March, gold was the first index to break above its 50-day moving average on March 24 th . It hit a new 8-year high this quarter. The QQQ was the second index to break above its 50-day moving average on April 14 th . The S&P 500 followed 10 days later. What these three indexes have in common is that if you have a lot of money to put to work quickly, you can do it in these groups fast.

It seems clear today that a lot of the “hot” money that was printed by the Fed ended up in the QQQ. As Herbert Stein is famous for saying, “If something cannot go on forever, it will stop.” This was true in 1999 and it will be true this time. As we wrote in our last letter, the end of this move will be when the dollar declines and inflation come back. Until then, it is going to be a party in the QQQ. We own Apple and Tesla. They are now two of our top five stock positions. Apple and Tesla are in the QQQ. When we first bought Apple at 57 in 2013, its phones were viewed as a commodity. The prevailing wisdom back then was their phones were doomed to be wiped out like Blackberry, Nokia and Motorola phones. Apple’s stock had declined that year by over 60% in 2013. Every week some analyst would do a channel check and say, “Sales are terrible; sell the stock.” When we bought Apple however, they had massive earnings to back up their stock price. We thought we could make over 20% a year from the stock if their earnings just stayed flat. Apple was a ridiculously cheap value stock in 2013. Today it has morphed into a growth momentum stock. Apple’s operating income is up 25% since we owned the stock. The price of Apple’s stock is up over 600%. Apple’s stock is not priced to make 20% a year today.

As a comparison to the tech-laden QQQ look at large-cap finance and oil stocks. These groups are not in the QQQ but they are in the S&P 500. The financial index I will use to judge finance stocks is the XLF. Its largest holdings are stocks we have been buying in the last year, Wells Fargo, J.P. Morgan, Berkshire Hathaway and Bank of America. At its peak in May of 2007 the XLF was trading at 31. Today it is trading at 24. In 13 years, the index (not counting dividends) is down 22.5%. The QQQ is up over 400% during that time frame. If you owned a basket of oil stocks during this time frame, you would be down 40% (not counting dividends).

The point we are trying to make is that investor sentiment for tech is now approaching something of a mania. It is the exact opposite for just about every other sector. The challenge we have managing our accounts is our mania stocks are doing fantastic, performance-wise, and our value stocks are doing awful. The dilemma all portfolio managers face today is do you chase what has been going up that is not cheap on a historical basis, or do you buy value stocks and risk missing the party? Back in 1999 the QQQ mania went on for about two years before it blew up on March 10 th of 2000. We think the key to the reversal of today’s trend is the dollar going down. When the dollar rallied dramatically in 2014, the QQQ’s outperformance went with it. Foreign investors and central banks have also been buying tech stock as well. The central bank of Switzerland has bought 17 million shares of Apple as part of its quantitative easing plan. Central banks would rather own tech stocks than a U.S. treasury bond on their balance sheets. When (some would say IF) inflation returns, the bank of Switzerland will have to sell tech stocks to shrink its balance sheet. This would also occur at a time when most likely the dollar is going lower, which would generate more sales from foreign individuals of U.S. tech stocks.

In 2000 we were accused of pulling the flowers and watering the weeds by not owning the dot- com out- performers. We are prepared to hear that again when we make some changes to your accounts over the next six months. We will buy value over momentum and wait for the party to find us. This almost always means selling what has gone up and looks great on a three-year look back to buy stocks that have not gone up. Does this mean we would sell all of your Apple or Tesla? No. That said, some of our accounts’ tech positions have grown above 10% or 15% of their accounts’ value. There will be some pairing back in those accounts. The money will be rebalanced into other positions or new positions that have been dormant for a while. The risk we have is that we sell some Apple at 350 and it goes to 600. That can happen. The reverse can also happen. We will keep you informed on what we do in our next letter.

Our three largest value stocks are Berkshire Hathaway, CenturyLink and BGC Partners. Their stock performance this year has been poor. Their fundamental performance to date has not been poor. We want to show you a few ways we think about holding them versus owning bonds. The value of CenturyLink’s stock is trading at 10 billion today. They are going to generate $3.2 billion of free cash this year. Last year it was about the same number. By generating that much free cash flow in a year, shareholders will get 33% of their money back in one year. In three years, you will get all of your money back. If you own a 10-year treasury bond today at 0.70% it would take you over 100 years to get your money back. We view a three-year payback in CenturyLink with earnings risk a better bet versus a 100 year payback in a government bond with no earnings risk.

CenturyLink will pay shareholders 33% of that $3.2 billion in free cash flow in dividends. At the end of three years we will receive a third of our investment back. The rest of that money stays inside the company to pay down debt. We view debt repayments as money accruing to the shareholder. We have calculated that it would take you about four years to get your money back on the cash flow BGC will generate and 10 years for Berkshire. When you consider these paybacks versus owning bonds, we are willing to assume the risk of owning stocks.

While the market has driven the value of large-cap tech stocks to new highs, they have punished Berkshire Hathaway’s stock because they are not a tech company. In the traditional sense they are not but let’s explore that a little. The market cap of Berkshires stock today is $433 billion. They have total assets of around $750 billion. Berkshire owns 250,866,566 shares of Apple’s stock. They paid $35,287 billion for it ($140.66 per share). In the last week of June, Apple’s stock was trading at $370 a share. At that price, Berkshires Apples stock was worth $92,820 billion dollars to shareholders. Apple’s stock represents 21.4% of the total value of Berkshires stock. It represents 12.3% of Berkshires total assets. Maybe Berkshire isn’t a tech company, but its largest asset is? Is it fair to label it as a finance company? Let us complicate that question some more.

Screen Shot 2020-07-20 at 11.45.23 PM.png

As we mentioned above, Berkshire Hathaway is the largest component of the ETF XLF that tracks finance stocks. When Wall Street talks about Berkshire, it is lumped in with banks and insurance companies. When you look at the chart above you can see that Berkshire has an extremely high correlation with the other finance stocks. Would it shock you to know that last year Berkshire earned $29.25 billion in pretax but only $7.017b of that came from finance? The rest came from Burlington Northern, Mid-American Energy and a host of U.S. manufacturing and retail companies. In 2018 finance was 25.3% of Berkshire’s earnings. In 2017 it was only 8.3% due to some bad reinsurance losses. The powers that be who decide what goes in an index have “cursed” Berkshire by putting them in the finance index. The truth is that Berkshire is so diversified that it really should not be put in any narrow index. How do you have an index that only owns stocks whose market cap is 20% Apple’s stock and generate 75% of their income from non-insurance. Good luck putting that index together. That said, you can see in the chart above how Wall Street trades Berkshire as a finance-only stock.

The last positive we will mention about Berkshire is that it is trading at 1.14 times book value as we type this. If you were to buy Union Pacific today, you would have to pay 7 times book. You can buy Berkshire who owns Burlington Northern at an 83% discount to what you would pay for Union Pacific. If you want to buy a boring old utility stock, you will pay around 2 times book value. You can buy Berkshire’s utilities at a 50% discount. You can buy Sherwin Williams paint stock at 18 times book value on the New York stock exchange. You can buy Benjamin Moore at 1.14 times book. The value is here. How it gets recognized and when has been a struggle for us to predict. At some point Buffett will do what is best for shareholders because he is the largest one. If that means paying out a dividend, buying back stock or making another acquisition he will (or his lieutenants will) do what is best for shareholders. In the meantime, he is considered washed up right after he just made $60 billion in Apple. Go figure.

We get a lot of calls asking us about our views on COVID and its effect on the economy. Please keep in mind that when we researched this subject in the first quarter our conclusion was 100% wrong in how the world’s leaders and markets would react. We did not think the market would drop over 20% and we did not think they would shut down the economy. We did not get that right. That caveat out of the way, here is our current working hypothesis.

Early in the crisis the perceived death rate for those people who got COVID was at 3.4%. That data was supplied by the WHO and China. That death-rate percentage is a horrific number. World leaders used that data to form public policy in March. The 3.4% death-rate decision was made based on the limited data and testing we had at that time worldwide. If that number was even close to right (it was the only one we had at the time), the world had to shut down, and it did. As the world’s testing has improved the death-rate data has been declining dramatically. The death-rate per infection is the most important number to focus on in our opinion. We think Stanford’s John Ioannidis work released in June is the best to look at on this topic. We have included the link below. His paper analyses 23 case studies from across the world. We will post his conclusion below. If his study is statistically accurate (its being reviewed by academics and the CDC now), the odds of another COVID shutdown seem exceptionally low to us based on the data. The risk of us dying from COVID would be higher than the yearly influenza we deal with but not by a catastrophic amount. We can deal with this while still leading normal lives. The death rate that this paper indicates we are experiencing from COVID worldwide is 0.26% and not 3.4%. This is welcome news to the world, and we are rooting he is right. A 0.26% death rate will not shut down the world’s economies. We can handle that rate with social distancing and masks until the vaccines start showing up later this year. Here is a selected paragraph from the paper we have used to summarize its conclusion:

‘’A comparison of COVID-19 to influenza is often attempted, but many are confused by this comparison unless placed in context. Based on the infected-fatality rate (IFR) estimates obtained here, COVID-19 may have infected as of June 7 approximately 200 million people (or more), far more than the ~7 million PCR-documented cases. The global COVID-19 death toll is still evolving, but it is still similar to a typical death toll from seasonal influenza (290,000- 650,000), while “bad” influenza years (e.g. 1957-9 and 1968-70) have been associated with 1-4 million deaths. While COVID-19 is a formidable threat, the fact that its IFR is typically much lower than originally feared, is a welcome piece of evidence. The median of 0.26% found in this analysis is very similar to the estimate recently adopted by CDC for planning purposes.’’

https://www.medrxiv.org/content/10.1101/2020.05.13.20101253v2.full.pdf+html

As always feel free to call us if you have any questions or thoughts.

Sincerely

Mark Brueggemann IAR Kelly Smith IAR Brandon Robinson IAR

Covid 19

The first quarter of 2020 will go down as one of the most volatile quarters for financial markets in U.S. history. We had the fastest decline into bear market territory in history. It only took 16 trading days for the market to lose 20%. This was a quicker start to a bear market than 1929 or 1987. The average stock is now trading at their price levels of 2011-12. The total decline in the average stock from their highs was 50%. A barrel of oil declined from $63 in January to $21. Most of that decline in oil happened in one day when OPEC broke up. The Fed injected trillions into the financial system to try to calm the markets. They also cut interest rates to zero on the short end. The reason for this mayhem: a virus called COVID- 19.

We started hearing about COVID-19 in January. After numerous discussions about it at work and its potential impact on the economy, we decided it would not be a major factor to our investments. We were wrong. We didn’t assess this situation correctly in the short-term and it cost us. We are deeply sorry for that. We will outline below our logic for holding on during this market break. In this letter we will also go into detail why we passed on selling, what we think is going to happen next, and how this may be the end of a 40-year deflationary cycle.

When the news came out about the problems China was having with this new virus, we became concerned. We read numerous web sites, newspapers, magazines, Chinese research papers and blogs to get information about how they were dealing with this. We also called doctors, researchers who had worked on Ebola and hospital administrators to get a better feel for this. We went back and studied previous pandemics and virus out breaks. In no order, they were SARS, H1N1, Ebola, MERS and the ordinary flu. At that time, it was our opinion the COVID-19 virus most resembled the SARS virus. Even though H1N1 was labeled a pandemic and killed around 12,000 people in our country, we thought how the markets and OUR governments treated SARS would be the best test case (no one died from SARS in the U.S.). As we have stated above, we were wrong in how we thought the world would deal with this virus.

The SARS virus started in December of 2002. During that time the stock market was in a serious bear market. The credit markets were in horrible shape based on the bankruptcies of Enron and WorldCom. The U.S. economy was still in weak shape. With all of that as a backdrop, the stock market bottomed in March of 2003 and took off. The SARS panic went away in July of 2003. Using that data as our base case, we then applied it to what we were looking at economically in January and February of this year compared to 2003. The economic stats were very strong in 2020 vs. 2003. The credit markets were very healthy. The stock market made a new high on February 18. That high was one month after China had reported to the WHO that the virus didn’t spread person to person. This proved to be a lie, but we don’t blame them for our losses.

We have been fully invested in the stock market since the Great Recession of 2008. Our guiding principle for those 12 years has been if there is no inflation, the federal reserves of the world will be able to print money to bail out financial investors in stocks and bonds. It was our opinion in February that, with commodity prices low worldwide and inflation low, and if we were wrong on the virus’s impact, the central bankers of the world would print money to raise asset prices. As of this writing, it appears, they will print an unprecedented $2 trillion this month in the U.S. alone. We thought this likely money printing would blunt the market declines to less than 20%. We were wrong on how severe this market would break even though we got the Fed response right. Why did the markets respond more severely this time than the last 12 years?

We did not see the governments of the world shutting down their economies by keeping people at home to the extremes they did. We thought some form of self-isolation would occur but not to the extent it was implemented. When something new occurs, like forced shutdowns of the world’s economy, the standard response for some investors is to sell first and ask questions later. We thought this selling would be contained at around 15-20% correction because the world’s central bankers would flood us with money. The S&P 500 was down around 35% as of this writing, so we missed that. Later, we will talk about where we think this market goes from here.

What we would like to do now is go over our top five holdings and explain what we thought about them in February and what we feel about them now. We think most of these companies will benefit from this, economically, though their stock prices aren’t showing it today. The next paragraphs will outline why we feel this way.

We have written in the past about how cheap Berkshire Hathaway is versus the market. Warren Buffett has recently been viewed by Wall Street as out of touch with today’s economy. He was criticized for sitting on roughly $150 billion in cash which represented 27% of his market cap. It was our opinion that if a bear market occurred, he would not only be an aggressive buyer of the market but also of his own stock. Last quarter he was buying back his stock (1.5% of the float) at over $205 a share (it’s $170 now). We think that the investments he is making for us today in this bear market will cause Berkshire to have record earnings and cash flow in 2021. We think the discount that Berkshire has traded at versus the market will now disappear as he will appear one of the big winners of this pandemic. For probably the last time (he’s 89), we had the world’s greatest investor sitting on cash going into a market panic. We can’t wait to see what he bought for us in this decline.

CenturyLink is the largest provider of bandwidth in the U.S. (using ethernet circuits as the yardstick). In December of 2019 the company announced a strategic partnership with Zoom. As travel restrictions have been put in place, video conferencing has exploded. Zoom is the biggest winner economically in this pandemic and CenturyLink is their preferred bandwidth and voice provider. CenturyLink also has “only” $1.2 billion of debt due this year (April 1). They have projected for this year $3.25 billion in free cash flow; $1 billion of that will be paid out in dividends, with the rest to be used to pay down that $1.2 billion in debt coming due. This leaves them with a cushion of $1 billion if times get tough. They astutely restructured most of their debt maturities by January of this year to limit their yearly debt payments (up to 2026) to about what their free cash flow is today minus the dividend. We don’t see any reason for them to go to the credit markets currently to borrow money. We see the demand for bandwidth exploding this quarter as schools, hospitals and business go online. They reported in the last week of March that traffic on their network was up 35% this month. We expect that trend to help cushion the blow of some small customers who can’t make it through this panic.

BGC Partners benefits when the financial markets are volatile. We anticipated them reporting higher earnings this quarter than they projected in February because of March’s market volatility. On March 26 they did confirm that they would outperform street expectations this quarter with record sales. Having rising earnings and sales in this market is very unusual right now. However, they then said they are having trouble conducting business during the last two weeks of March. They have 5,200 employees. We are ASSUMING they are having problems getting their workers (and their clients they sell to) to their desks because of the quarantine. Their three main trading floors in the U.S. are in New York. Their fourth largest trading operation outside the U.S. is in London. Because of the uncertainty of when they will have everyone back (and their clients have everyone back), they cut their dividend to increase their cash on the balance sheet. Here is how they stated that dividend cut in the 8k. “The Company took this step SOLELY out of an abundance of caution in order to strengthen its balance sheet as the world faces these difficult and unprecedented macroeconomic conditions.” The phrase “solely out of an abundance of caution” means to us a more positive view than we are in dire straits. We don’t blame them for conserving cash until they know the status of when their workers can return in these two cities. We don’t expect this virus to damage the business model of the company. We believe long-term it will help it. The CEO of this company lost 90% of his work force in 911. After that event, he then rebuilt the company and grew it to record profits. If he thinks this is what he must do in the short-term, we support him. As for what happens next on the dividend, they said this: “The Company and its Board of Directors intends to review and reassess its policy with respect to dividends and distributions as global conditions become more clear.” We are hoping the word reassess means the dividend could be coming back when the world is clearer. We will know more in May at the latest.

We think, in the short-term, that Apple Inc.’s earnings will be impacted by this pandemic. They are the only company of our top five that we think will have a revenue or earnings impact from this. We held the stock because they were sitting on $207 billion of cash at the end of the first quarter. In the fourth quarter of 2019 Apple bought back 1.5% of their stock. We expect that number to go up materially this year. There have been rumors they are interested in buying Disney. We don’t see that happening, but it is possible they use their cash to increase their media content to compete against Netflix. Tim Cook has been a good steward of the money. We think he will increase the value of Apple in this downturn.

Our last stock has been on a real roller coaster this quarter, Royal Gold. On March 16, with gold trading up for the day, Royal Gold’s stock traded down to 59 (a decline of 15%) before going up 37% for the day to close at 81. That’s a year’s worth of trading in one day. If you are a big believer that the central banks of the world are going to print money to devalue the dollar, you need to own some gold. This is our bet that the central bankers of the world are going to create inflation again by unlimited money printing to monetize our fiscal debt. As of this writing, our central bank is going to increase the Fed balance sheet by over 30% in one week. One week! We have continued to hold this stock because of our belief that when the secular bull market in financial assets (stocks and bonds) finally ends, this stock will be leading the way up. What’s our view for the next 18 months if you think gold will eventually be the asset of choice at some point this decade?

For 12 years our guiding philosophy on a macro view has been to be long financial assets (almost always stocks) until there is inflation. Each market decline during that period was met by the central banks of the world printing money. This eventually helped our accounts go to new highs each time. It allowed us to buy the flash crash in 2010 when the market lost 8% in 10 minutes. That view was tested in 2011-12 during the European financial crisis. When Greece defaulted, our market had three 15% plus corrections in 12 months. Our macro view was our guiding light in the breaks of August 2015, February of 2016 and finally the 20% stock market correction in December of 2018. Today’s decline of 40% (Value line composite) in one month is the worst one we have dealt with in the last 12 years. As we stated above, it also caused the central bankers of the world to flood the markets with more money than we could imagine. We believe the pattern of money printing and rising financial assets is not broken. We think within 18 months the markets (and our accounts) will be trying to make news highs. We understand this view is a minority one after a decline of this magnitude. The playbook of the last 12 years is being put to the test. We think it’s still valid.

If we are wrong on the market going back up substantially, we hope that the five stocks that are our largest holdings will overcome the markets downward pull should it decline. We think that’s possible for our stocks based on what we stated above. We do not believe, however, the path the market is going to take is down. The last time we predicted a bull market like we are now, was in our yearend letter of 2012. It’s on our website (trendmanagementinc.com) if you wish to critique it.

The doomsday scenario: What does concern us? How would the end of a central-bank-induced bull market end? It would start with fiscal irresponsibility at the federal level. The bailout today of the economy/market will raise the debt to GDP of the U.S. economy to its highest level in the last 50 years. Our debt to GDP has been moving up for the last 12 years without inflation showing up so far. This time we think it’s different. We are reaching an inflection point in how much debt we can pile on our economy. Once we go over 120% of debt to GDP, we think it creates real problems that are not solved easily. The following scenarios we think will play out over the next market cycle as we switch from deflation to inflation.

In previous market crashes where the Fed stepped in, it is our guess that 90% of that money went to supply credit to businesses. In 2008 a preponderance of the money went to banks and financial institutions. Most of this money didn’t “circulate”; it stayed on the financial companies’ balance sheets to keep them afloat. This time the epicenter is not the financial markets (banks) as much as it is “the real” economy and workers. It appears that around 50% of the money being printed in the $2 trillion stimulus bill is going to end up in the pockets of the public, whether they were working or not. This money is going to be spent. It won’t be saved, it will circulate. When the public spends this money, it is going to widen our trade deficit with the rest of the world. A wider trade deficit will put immense pressure on the dollar to go lower to offset the U.S. spending too much money.

It’s our belief at Trend that one of the main causes for the lack of inflation the last 40 years is a decline in world population growth coupled with the deflationary effects of free trade. For the next year we are willing to predict that world population growth will have a spike in nine months. With the world shut down for about a month, there are increased odds that people will find other things to do than watch Netflix. In the 1977 New York black out that lasted only one day, it was reported there was a 35% spike in births nine months later. When you have kids, spending goes up. This is not the main reason inflation may come, it will just help it along.

Over the last 40 years there have been numerous trade pacts signed to help lessen the wage pressures of U.S. workers while lowering the cost of products. We see that reversing under this administration or a Biden administration. It’s a trend that isn’t going to stop no matter who gets elected. Under this pandemic the U.S. woke up to find out that most of their pharmaceutical drugs weren’t made in this country. Ventilators and masks were easier to find in China than in the U.S. This type of news, when you pay the highest health-care costs in the world, are not going to go over well with the American public once this ends. The same goes for anything made in a foreign country that can be disrupted by the next virus. We think the days of creating a widget in Silicon Valley and shipping the manufacturing of that widget overseas is going to slowly reverse. It will take time, but we think it’s going to occur. When it does, the wages of U.S. workers will accelerate compared to what we have seen for the last 20 years. Before the market crashed this year, wages were up 3.2% for U.S. workers. This was the highest increase in wages compared to inflation in quite some time. What allowed the Fed to print money THIS time “to save us” was the dollar was strong and commodities were very weak. We think when the economy returns to growth (Q3), wage pressures are going to accelerate along with commodities worldwide.

To sum up, the economic data that would cause us to lighten up on stocks, you need a declining dollar, higher inflation and a budget deficit that can’t be funded by the Fed buying bonds. We are not sure how many years it takes for that scenario to hit, but it’s closer now than it was six months ago.

We have included charts at the end of this report to help you see what you just lived through. They are dramatic visuals of what was one horrible market. We are sorry we had to live through this. We have given our logic for why we have stayed fully invested. If you would like to call us, please do. Our number is 417-882-5746.

Sincerely

Mark Brueggemann IAR Kelly Smith IAR Brandon Robinson IAR

They Are Still Dancing

We started the year with optimism that 2019 would represent a bounce back year from 2018’s bear market. I think we can safely say that the market did more than just bounce back; it took off. The S&P 500 finished up around 30%. We were up 30.7% in our managed account. What caused this to happen and what’s next?

We think it is appropriate to say that the bull market that started on March 9 of 2009 is the most hated we have seen in our careers. How can you hate a market that has gone up over 400%? By not owning it! Peter Lynch wrote in one of his books, “More money has been lost preparing for a recession than the actual recession.” We believe that to be true with this market. We can understand why investors would not want to own stocks for a while after the disaster that was the Great Recession of 2008. Seeing a market decline over 60% will cause fear in the most hardened investors. What is surprising to us is how this negative sentiment won’t go away 10 years later.

Barron’s did a survey in the fall of big money investor sentiment. Here is what they said,

“After a big year for U.S. stocks—make that a big 10 years—America’s money managers see trouble ahead for investors. Blame it on the market’s lofty valuation, a muddled economic outlook, or the increasingly fractious political landscape, any of which could stifle stocks’ advance in coming months. Whatever the case, only 27% of money managers responding to Barron’s fall 2019 Big Money Poll call themselves bullish about the market’s prospects for the next 12 months, down from 49% in our spring survey and 56% a year ago. The latest reading is the lowest percentage of bulls in more than 20 years.”

When you have a 20-year high or low in investor sentiment, it generally means that you should bet on the opposite of what the majority thinks. In 2019, that logic paid off again. After that survey was taken, the president was impeached, a mini trade deal with China may or may not happen, manufacturing sentiment was negative, the yield curve was inverted because of recession fears and yet stocks went to new highs. Why?

We have repeatedly stated that the most powerful man or woman in the financial markets is whoever is running the Federal Reserve of the United States. The action of the repo market in September was proof that still holds true. The repo market is an obscure place for most investors. We won’t get into the plumbing of how it works other than to say it helps fund Wall Street and the U.S. government’s borrowing needs. Starting in September, the interest rate on repos went above the interest rate range the Fed wanted it to be at. Instead of the rate being 1.5% to 2%, it was over 8%. This surge in interest rates indicated that there was a huge shortage of cash available to fund the banks and Wall Street’s funding needs. To alleviate the “cash squeeze” going on in repos, the Fed started injecting billions of dollars into the system. The stock market started to go up from there and didn’t look back.

Wall street is estimating that the Fed is going to inject around $500 billion into the repo markets. It is our opinion this is the start of quantitative easing 4 (QE4). Wall Street loves it when the Fed throws money at a problem, and this time was no different. What we found interesting at the start of QE4 is that value stocks and commodities started to outperform growth stocks for the first time in quite a while. We own a bunch of both, and it helped our accounts beat the Dow and S&P 500 this year. When does this end?

The Fed can print all the money it wants to boost asset prices (stocks and bonds) until there is inflation. At that point they have difficult decisions to make: fight inflation or let the economy run hotter. It has been our opinion that the Federal Reserve THIS TIME is going to let the economy run above its 2% inflation target before trying to stop it. What the Fed did in the repo market this year reaffirms our belief. Even with the economy at record low unemployment, stocks up 20% for the year, the Fed decided to print more money in September to boost the economy. This is very rare. Hence, you had a year-end rally in stocks that was one for the record books.

We think the end of this bull market comes when either the dollar goes lower, inflation picks up, or more likely both. If the dollar declines it will help value stocks more than growth stocks but at the cost of losing the support of the Fed. There is a lot of foreign money in this market that we think bought growth stocks. Should our currency decline, we think foreign investors will be net sellers of the growth stocks they have been buying.

We want to point out how some of the stocks we owned did this year. The winner for best return of the year was Maxwell Technologies. It started the year at $2.07 and finished at $8.07. Along the way it was bought out by Tesla. Elon Musk’s company had a great year and it helped our portfolios a lot. Royal Gold started the year at $85.65 and went up 42.4% to $121.97. Apple Inc. started the year at $157.74 and finished at $293.65 (a gain of 86.16%). The last stock we want to highlight is Newmark Group. It was one of our worst performers last year, and this year it went up 67.7% ($8.02 to $13.45).

Stocks that didn’t do as well this year were two of our three largest holdings, Berkshire Hathaway and CenturyLink. Berkshire was up “only” 10.93% while CenturyLink’s total return was -6.3%. BGC partners total return came in at 39.7%. We view each of these stocks as very undervalued at their current prices. We think they will help carry out portfolios over the next few years as our winners cool off some.

We want to close this letter by writing about CenturyLink, our worst performer this year. In our second quarter report (it’s on our web-site for July 1, 2019, Emotional Markets) we wrote about how a stock being up year-over-year causes momentum investors to buy more of that stock, not less. We mention this because most of our stocks will now be up year over year on December 31. The one exception is CenturyLink. At its present stock price, it will be up year-over- year in the third week of February. At that point we expect the wind to be at their back for the first time in two years. The stock qualifies as one of the cheapest stocks in the market, but the fact that it is not up year-over-year keeps the momentum buyers from owning it. CenturyLink also has a poison pill expiring in November, which limits how much large institutions can buy of their stock. Once that pill is lifted, it makes this stock a potential takeover candidate. This stock hasn’t been a lot of fun to own the last two years. The odds favor that ending this year.

Sincerely

Mark Brueggemann IAR Kelly Smith IAR Brandon Robinson IAR

Extreme Gaps for Growth & Value Stocks


This quarter the S&P 500 was up 1.1% or about 35 points. That number does not give justice to the volatility we have been watching lately. In this letter we will outline some of the changes that have been going on behind the scenes and what it might mean for your accounts.

In the month of August, the S&P 500 had an average trading range of 1.43%. Even though the market finished up 1.1% for the quarter, the market fluctuated more than that every day in August. If you felt worn out at the end of that month, you had a right to. When you have huge intra-day volatility without the market going anywhere, it’s a sign of a change in leadership of the market. We have pointed out in previous letters that the leadership for this market has been growth stocks and particularly companies that grow revenue without making money. Lately the growth stocks are having problems, and there is an investor shift to look at value stocks again. We can see it in our model account. At the end of March our model account was up 6%. At the end of June, it was 10% and now its 14%. 

We want to point out some examples of how extreme the gap has been between growth stocks and value stocks. We will use the Russell 1000 as our test case. For the Russell 1000 we ranked its 1000 stocks into five quintile groups. The first quintile was the most expensive stocks in the Russell 1000 and the fifth quintile was the least expensive. To get a long-term frame of reference on how these quintiles were valued, we looked at data going back to 1951. The average difference in the price-earnings ratios for the most expensive to the least expensive over the last 70 years was 25.5 (highest average P/E of 32.9 and the lowest P/E of 7.4). Today the difference between the most expensive stocks and the least is 61.3 (71.6 today for the highest P/E and 10.3 for the lowest P/E). Investors are now willing to pay over twice the 70-year average for growth. Some of you may say that’s justified because the more expensive stocks grow at a higher level, which is true. However, the market is expecting the most expensive stocks to only grow their earnings by 3.1% more than the least expensive stocks. Paying 71.6 times in earnings for a CHANCE at 3.1% more growth versus paying only 10.3 times for the slower growing quintile of stocks is a bad bet. At some point we think this ratio will revert to the mean difference in P/E’s of 25.5.

What about dividend-paying stocks? We have included a chart below this paragraph showing the relationship between high-dividend paying stocks and low-dividend paying stocks. As you can see in the chart, high-dividend paying stocks are the cheapest they have ever been versus low-dividend paying stocks in the last 50 years. We find this chart another indicator of investors’ willingness to overpay for growth. We all remember the English proverb: “Do you want to keep the bird in the hand or try to get two in the bush?” Today the bushes are winning big time. We have a lot of high paying dividend stocks that have been affected by this. We are rooting for the bird in the hand to make a comeback.

Screen Shot 2019-11-15 at 12.18.26 PM.png


Before we leave the subject of valuation extremes, we want to post some data from 2017 that we find fascinating. This trend continued into 2018 and may finally be ending.

Screen Shot 2019-11-15 at 12.19.59 PM.png

The chart above shows all the major equity indexes and how they performed in 2017. To help investors see which groups did the best inside these indexes, they divided the stocks into the largest market capitalization stocks to the smallest. We want you to focus on the largest five market capitalization stocks (column 3) and the smallest quintile stocks (last column). Because most of us are familiar with the S&P 500 index, let’s use those numbers to highlight what’s going on with the index crowd. Inside the S&P 500 in 2017, the five largest market capitalization stocks went up 45.3%. The smallest stocks were down (1.1%). If you look at the rest of the popular indexes, it’s a similar trend; the larger you are, the more your stock went up. The smaller you are, you struggled. The performance gap between large-cap- index stocks and small-cap-index stocks was in some cases over 90%. Why does this matter? What does it mean?

The trend in investing right now is to index to a select group of stocks (S&P 500, Russell 2000, etc.). Active managers are being liquidated and the money is being placed in index funds to own 500 or 1,000 stocks versus just 20 or 50. That sounds good in theory, but as the previous paragraph pointed out, something is going wrong with the execution of the indexers. There IS NO WAY if you are indexing according to market capitalization that the largest stocks IN ALL OF the indexes are doing 58% better than the smaller ones fundamentally. As you can see from the chart it’s a worldwide phenomenon. In theory when you put $1,000 into an index fund, the money would be split according to the market capitalization of the stocks equally. This would make it where if the index is up 20% for the year, ALL STOCKS in that index for the most part would be up the same amount regardless of whether they were large cap or small cap. We know that did not happen in 2017 because the large-cap stocks were up on average 58% more than the small caps. What does it mean?

We think that the indexers and those who mimic them are not actually indexing. They are looking to buy SOME stocks in the index but not all of them. The primary determinant of what they buy in the index is stocks with liquidity that they can trade quickly. This would explain why the five largest liquid stocks are trouncing the less liquid stocks. Liquidity is more important than earnings or valuations. The indexers are “bending” the rules to accommodate the trading flows of Wall Street. What it means to us is that there is value in smaller stocks versus larger stocks even though they are in the same index. We get asked the question a lot: Is the market overvalued? We usually answer it by saying it is overvalued by about 10% to 15%. What would be a more accurate answer is the market is overvalued for large cap-stocks and undervalued for small-cap stocks. When (not if) there is a market correction, the large liquid high- capitalization stocks that everyone is buying in the index today will be hit the hardest. Most of those are the large technology growth stocks instead of the value stocks we own. You want to be very careful owning the five large-market-cap stocks in any index. You would have done amazingly well if you only own the five largest stocks of every index, but it won’t last. They will be the first stocks sold when “passive” index money flows the other way.


We have written about these extremes in the market to help you understand why we are fully invested in a market that is statistically overvalued. Most of our positions are not in the “favored” categories of high revenue growth, high price-earnings ratios and low dividends. We feel when that group gets liquidated, the money is going to come our way (like the dot-com top of 2000). Hence, we are willing to sit through the ups and downs of August waiting on a reversion of the mean to historical standards. We are currently looking at investments in small-cap value stocks to increase our bet on a reversal of these trends.

We want to finish this letter with a brief comment on the economy. The yield curve has inverted (short rates are higher than long rates) and the investing world is concerned. The yield curve usually inverts when we are heading into a recession. We don’t see a recession happening in the U.S. this year, but we do think Germany and China are in one now. Their economies are the biggest victims of the trade war going on with our president. Depending on how they react to this recession will determine whether the U.S. goes into one next year. If they decide to not increase the consumption of their citizens by decreasing the value of their currencies, or by not running fiscal stimulus, it will be hard for the U.S. to grow very much in 2020. If they stimulate their economies, then the U.S. will do OK next year. As of this writing it’s too early to say what they will do. The interest rate on a 20-year German bond is negative 25 basis points. That means investors are comfortable locking in a quarter-point loss every year for 20 years for the privilege of owning a German government bond. For the world economies to function well, that must end.

Our holiday party will be on Thursday, December 19.  Please save that date. Kelly will be sending out the invitations the last week of November. Don’t forget to RSVP.


Sincerely


Mark Brueggemann IAR                                 Kelly Smith IAR Brandon Robinson IAR


EmotionalMarkets

The financial markets have been very emotional this quarter. The stock market

had a 7% correction in May followed by a 7.5% rally in June. Ten-year U.S.

government bond rates are trying to go below 2%. The world has the lowest rates

we have seen since 2016. The 10-year German government bond rate is now a

negative 35 basis points. This means you PAY the German government every year

almost a half percentage point for the privilege of loaning money to the

government. U.S. and China are in a full-blown trade war with no end in sight.

What does it all mean?

We don’t see the U.S going into a recession this year. The economy is slowing but

we don’t see GDP going negative. The bond markets of the world disagree with us

and are pricing in a recession. The way the bond market prices in a recession is to

take long-term interest rates below short-term rates. Today the 10-year Treasury

in the U.S. is 2.03% and the three-month Treasury yield is at 2.20%. When you see

this happen, it’s called an inverted yield curve. The bond market is saying the

odds of a Fed rate cut are high on the short end of the curve. To trade on that

view bond investors will “lock” in their money at the 10-year rate even though its

lower than the three-month rate. The bond market is willing to accept lower

interest rates now because it is convinced the economy is going to be much

weaker next year.

We think the inverted yield curve in the U.S. is a mistake by our bond market. The

U.S. is at record low unemployment, credit is flowing freely, and we don’t have

any big inflationary bottle necks in the system. HOWEVER, the rest of the world is

struggling more than we are, which is putting pressure on our bond market. Our

interest rates are being pushed lower because of them. The trade war is

influencing the rest of the world far more than it is us. We think economic growth

in the U.S. will keep the rest of the world from going into a recession. We are also

taking note of the very recent desire of foreign central banks to increase their

monetary stimulus. This will help the world stave off a recession.

We started writing about a coming trade war with China over five years ago. It’s

here now and we don’t see it going away. The genie is out of the bottle and it’s

not going back in. Our blueprint for this trade war is what happened in the last

trade war in 1971. We thought U.S. economic growth would pick up (check), the stock market would rally (check), unemployment would go lower (check),

commodities and the dollar would go lower (big miss so far). We thought the rest

of the world would run simulative fiscal and monetary policies to replace the lost

sales in the U.S. So far that has been slow to occur. Why?

The Germans (who run the European Central Bank), China and Japan all want to

have trade surpluses with the United States. The political leadership of those

countries believe a trade surplus is the best way to insure a vibrant economy

long-term for their people. There are numerous ways to gain an advantage on

your competitors when trying to have a trade surplus, tariffs, value-added taxes,

foreign ownership rules, currency manipulation-to name just a few. One way that

isn’t talked about is suppressing what your people can consume.

The German’s started the process of suppressing the wages and benefits of their

citizens by passing the Hartz law in 2002. At that time the unemployment rate

was 13% in Germany. The Germans were worried about another great

depression. They wanted to improve the competitive position of their

corporations, so they passed the Hartz law to help. In the law, the unions and the

corporations of Germany agreed to pay their workers less than they should get in

return for the companies agreeing to keep most of their jobs in Germany. The

Hartz law also revamped the German welfare system so that you got less money if

you didn’t work. The net effect of this law was to take money away from their

citizens and give it to their corporations. By restricting the purchasing power of

its citizens to buy US products or anyone else’s products, Germany now runs the

world’s largest trade surplus as a percent of GDP in the world.

Ten years ago, in China, consumer consumption represented 50% of its GDP.

Today it is below 40%. As China’s trade surplus has grown, their citizens have

received less money than they should have. In Japan, they passed a consumption

tax on their citizens. When individuals buy something in Japan, they are taxed

more today on that product than you were 10 years ago. This tax was passed to

discourage consumption.

Contrast these moves with the changes in the U.S. tax laws in the last 15 years.

We are lowering personal tax rates, increasing depreciation for business,

increasing tax breaks for business at the state level while increasing deficit spending by our federal government. The U.S is trying to increase consumption

while our trading partners are trying to restrict it. As a citizen I am happy about

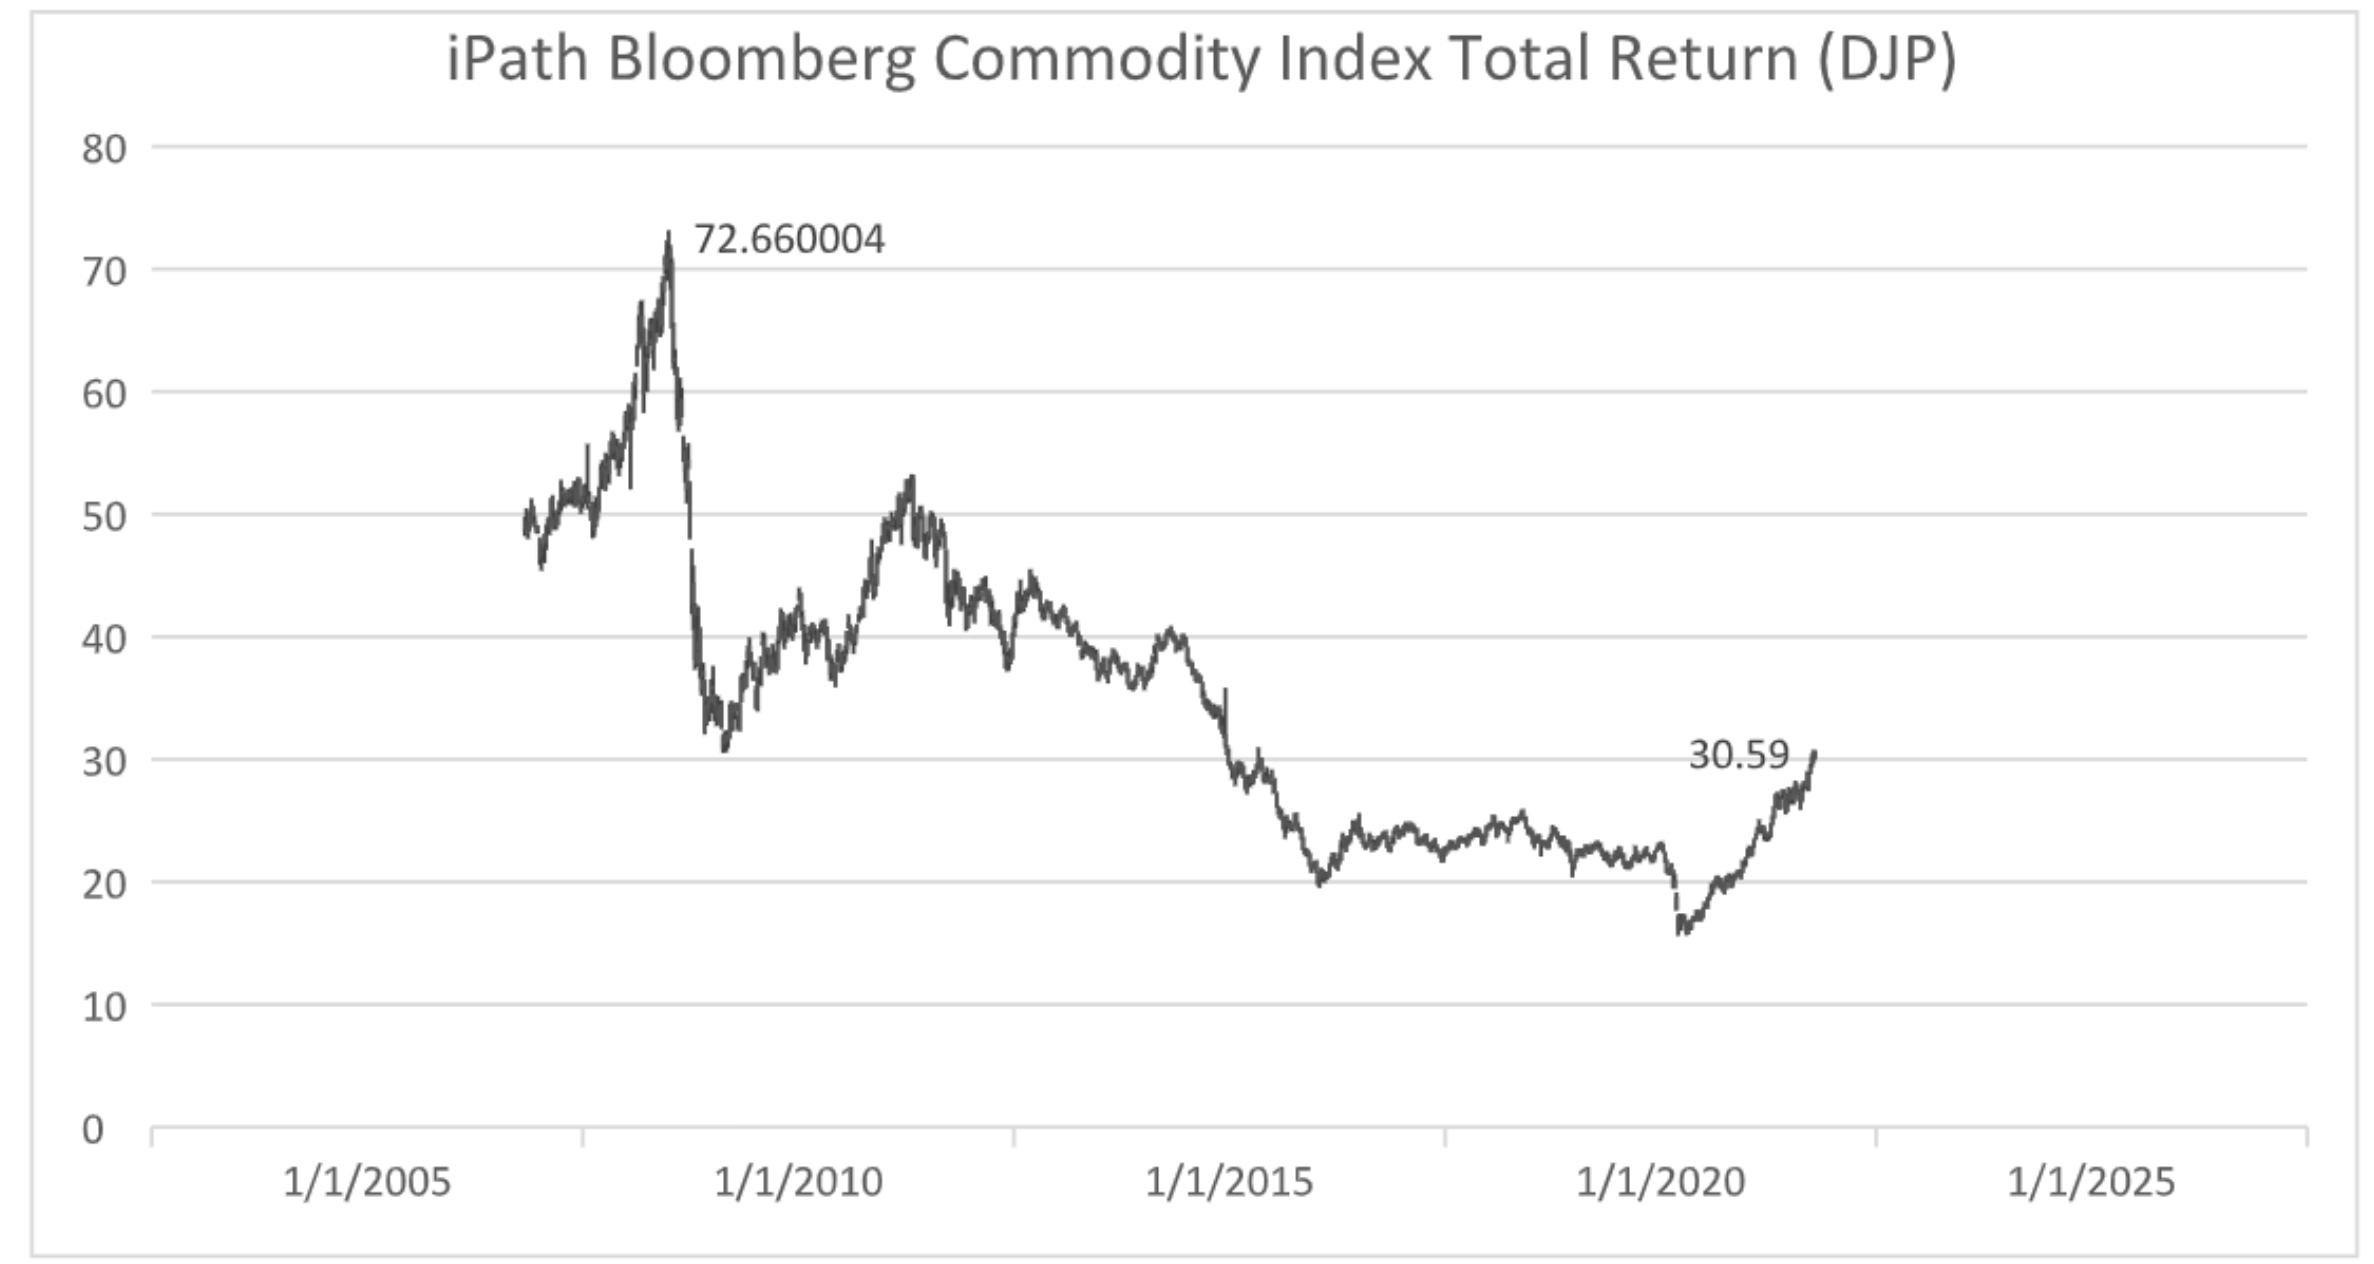
lower taxes, but that will come at a cost of a higher trade deficit. We continue to

think a higher trade deficit will result in the dollar going lower. The dollar going

lower should cause gold and commodities to go up. We can’t declare victory on

that thought process yet, but we aren’t backing away from it either. To finish this

subject, we would like to note that our only gold stock, Royal Gold, made new all-

time highs this month. Perhaps the gold market is starting to agree with us.

We want to write about some crazy things Wall Street has been doing lately that

it has stolen from our efficient-market professors in academia. As a refresher on

academic thought, the professors at our colleges have stated that the markets are

efficient, and you can’t beat the market. This theory got started over 30 years

ago. However, when academia did more testing on the efficient-market theory

(EMT), these professors found out that value stocks did beat the market over

time. They also found out that small caps beat the market. This was followed by

momentum stocks beating the market. Another favorite is low volatility stocks

beat the market. There are more anomalies that academia can’t explain but we

will stop there. So to sum it up, the markets are efficient until they aren’t. Most of

the time the reason they give for not being right on value, low volatility, small cap

and momentum stocks doing better than the index is that they are riskier. Hence,

they have a value premium attached to them. We find that logic lacking but we

will move on. Why does this matter to you?

There has been an explosion in money allocated to “factor” funds on Wall Street.

A factor fund is simply a fund that manages money based on one or more factors

that academics say will beat the market, like value, small cap etc. Factor funds

take the academic studies of the market and apply them to today’s stock market.

We will outline how these funds manage money for value investing, which is what

we do.

If a factor fund wants to “beat” the market using value as its criteria it will do a

search of all 12,000 stocks in the market (most searches excluded finance

companies). It will look for the cheapest stocks based on THEIR definition of value.

That definition could be low price to book, low price-earnings multiples, high cash flow etc. After they have ranked the stocks at 1 through 12,000, they might buy

the 100 cheapest stocks and move on. Or they might try to improve on this

system by introducing momentum into the equation. Since academia says

momentum beats the market, how can we sort these stocks based on that? What

is momentum?

The seminal study on momentum was written years ago in academia. The study

defined momentum as a stock that was up on a one-month, three-month and 12-

month basis. They would use that momentum criteria to buy the cheapest value

stocks that were also TRENDING UP over these time frames. They would then

rebalance the portfolio at the end of every month to keep the portfolio fresh. Not

only would they have value as a factor they would combine it with momentum to

“double” their chances of beating the market.

In the world of physics, they have a saying that when you observe an object, your

observation of the object changes the way the object will behave. If you want

proof of this phenomenon watch how fans at a football game act when a TV

camera is turned on them. They act differently than when they aren’t on camera.

We think the same phenomenon is occurring with momentum. If everyone is

using momentum as a tie breaker in whatever factor you choose to invest in, the

driving force of the market is momentum and not the value, small cap factors you

invest in. What this means to us is that cheap stocks will keep getting cheaper and

expensive stocks will keep getting more expensive until they reach extremes. The

momentum “tie breaker” will be the driving force in how the stock market trades

since almost every factor fund uses it as the tie breaker.

We offer up the FANGs (Facebook, Amazon, Netflix and Google) as proof to the

upside of how this works. We offer up Centurylink, BGC Partners and Berkshire as

to how this works on the downside. At the peak of the FANGs popularity in 2018

their collective P.E. was over 100, which is crazy. However, the FANGs stocks were

up on a one-month, three-month and one-year timeline, which means you hold

them or buy more. They have momentum. In May the average PE of CenturyLink,

BGC Partners and Berkshire was under 9. None of those stocks were up on a one-

month, three-month or one-year basis (Berkshire was on a yearly basis only).

These stocks are extremely cheap but if they don’t have momentum, a factor fund won’t buy them. They will wait until the stocks go up to buy them, which seems

crazy to us. Because we hold stocks on average for seven years, we bought more

of the above stocks this quarter even though they have negative momentum. We

are willing to accept short-term underperformance to buy stocks that are three or

four times cheaper that the market. Eventually these stocks will have price

momentum again and join the party.

Our guess is that individual stocks will reach extremes in both directions because

of momentum being used as the tiebreaker in almost all of the factor systems.

Once a trend is exploited on Wall Street, we call that a “crowded trade.” If

everyone is doing it, the valuations become distorted from reality, and it ends

when the companies can’t produce enough positive earnings or sales to support

the stocks lofty valuations. When that occurs, the declines are quick and vicious.

You then have momentum working against you during the decline. We have

written in previous letters how this market reminds us of the 1999-2000 dot-com

bubble. When it burst, the no-momentum stocks did great and the high-flying

ones did not. We expect a replay of that to occur again.

We want to highlight a crazy flaw in discounted cash-flow models that have

helped move stock prices. We have included a chart at the end of this report on

the stock performance of companies that lose money. On average these

companies lose 3% a year and rarely go up. However, there have been two years

where money-losing stocks have done very well compared to the markets, 1999

and 2018. In 1999 money-losing companies made 19% and last year (which was a

down year for the market) they made on average 7%. Why would investors bid

these stocks up in those two years? The answer is it involves how you use a

discounted cash-flow model to calculate what a stock will be worth in 10 or 20

years.

If you do a discounted-cash-flow model, you put in an assumed PE multiple, an

estimate of how much the earnings will grow (and for how many years it will

grow) and what the risk-free rate you want to discount those earnings by. If you

have a sudden drop in interest rates, it benefits those years way out in the future

compared to the early years. This means the value of money-losing stocks goes up

more than companies that make money because of using a lower discount rate on the earnings of a company 10 and 20 years out. Though short rates went up in the

U.S. last year the rest of the worlds interest rates dropped particularly at the long

end. Today we have $12 trillion of bonds trading at negative interest rates, which

makes these money-losing companies more attractive. When interest rates go

back up again these stocks will have a rough time. We won’t elaborate any more

on this subject, but if you would like to read up on it, here is the link.

http://www.efficientfrontier.com/ef/401/fisher.htm

Finally, we want to write about Tesla. We exchanged our Maxwell stock for Tesla.

Why accept Tesla’s stock? We believe that the world is headed toward electronic

self-driving cars. Governments across the world are tackling fuel-emission

standards to lower the amount of carbon dioxide in the air. Technology has

allowed the range of electric vehicles to increase along with an increase in

electric-charging infrastructure. We see the growth of battery electric vehicles

(BEV) increasing. According to a report from JP Morgan, the average growth for all

autos in the U.S. over the next five years is flat to slightly negative; however, for

electrics the growth is north of 30%. For electric vehicles sold year to date, Tesla

currently holds a 55% market share for the U.S. and 7% for the world. We expect

Tesla’s world share to increase once it ramps up production in China this year.

We were surprised no other company offered to put in a bid for Maxwell’s

technology. However, the more we dug into it, it seems no other auto

manufacture or auto OEM was as far along as Tesla in manufacturing electric cars

and batteries. Tesla saw something in Maxwell’s technology that we think other

buyers missed. With less buyers to compete with, they took advantage of it. The

only other likely buyer would have been one from China, which due to U.S. trade

tension, never would have gotten regulatory approval. However, we think

Maxwell’s dry electrode processing, coupled with Tesla mass-market potential

and technology wizardry, has the potential to produce a battery that can increase

the driving range and lower cost, which will further increase Tesla’s lead in the

fastest segment of growth in the auto industry.

Tesla’s software also sets it apart from its competitors. The self-driving

technology as well as the ability to change the cars’ performance and specs with

an over-the-air software update are impressive. We understand the controversy this company runs into, and we will be watching with a careful eye its balance

sheet and cash flow. Tesla, had negative cash from operations in Q1 due to more

deliveries taking place in Europe, but expect to be cash-flow neutral/positive in

the second half of the year when their European expansion is over. Tesla also

announced sometime in Q3 they will be hosting an Investor Battery and

Drivetrain presentation, where they will give more details of what they have

planned with Maxwell’s technology. We will stay tuned to what they say.

This was a very long letter, but we had a lot to talk about. Feel free to call us at

417-882-5746 if you have any questions.

Sincerely

Mark Brueggemann IAR Kelly Smith IAR Brandon Robinson IAR

Worst December Decline in 90 Years

Trend Management, Inc. Year End Letter 2018

In the fourth quarter the stock market had its worst December decline in 90 years. It also had its worst ever percentage decline on Christmas Eve. Two days later the Dow had its largest up move point-wise in history. The markets are a volatile mess right now. We will get into the details below on how we plan to handle it.

We have been saying for about two years now that the stock market is 10% to 20% overvalued. That has now changed with this decline. With the S&P 500 at 2400 we now view the market at fair value. We believe interest rates are still overvalued by about 50%. In our view stocks are still the best investment long- term versus cash or bonds. The fourth quarter decline in stocks has not changed our view.

We have a model account whose performance we have audited from 1998 to the present. We think the performance of that account fairly represents how our average client’s returns have been during that time frame. The account is a retirement account where no money goes in or out. During the 21 years that account has been active we have had six losing years. We are averaging a losing year about every 3.5 years. The losing years were 1999, 2007, 2008, 2011, 2015 and now 2018. We have had only one back-to-back period when we lost money two years in a row. That was the Great Recession of 2007-08. During this 21-year time frame we beat the return of the S&P 500 by almost 100%.

What we find interesting about this history is there were two bad recessions during this 21-year period, 2001 and 2008. In 2008 the decline was horrific for virtually all financial assets except cash. There was no place to hide. Everything went down. There were no stocks that survived that meltdown. In the 2001 recession there were stocks that went up despite the dot-com bubble burst. We think the 2018 equity market resembles 2001 and not 2008. We think our accounts are set up for a good two-year run of positive returns. Why?

Screen Shot 2019-02-05 at 11.12.20 AM.png

In 1999 most value stocks did very poorly before the dot-com bubble burst (see chart above). Berkshire Hathaway’s stock dropped over 50% during this time frame. At the time, Warren Buffett’s investing approach was considered out of touch with how to make money in the new world. There were reports that investors in Omaha were stopping him at dinner and asking when he was going to change his “old way” of investing. He was viewed as past his prime (he was in his60’s). They were wrong. He gave a very public speech in August of 1999 telling the investment community why what he was doing was still going to work. He missed the bottom in his stock by eight months.

The only thing investors wanted to do in 1999 was chase momentum stocks in technology and telecom. Those stocks did amazing compared to value stocks. The more tech went up, the more investors bought them and sold value stocks. At the peak of the mania in 2000, tech and telecom represented 33% of the valuation of the S&P 500 even though they made very little money.

Some of the metrics investors used to price the tech stocks were how many visits a web page got and how many eyeballs were looking at those pages. Whetherthose companies made money didn’t matter. The mantra was just keep growing page hits and eyeballs. If you do that, Wall Street will drive your stock higher. That all ended on March 10, 2000. On that day, the dot-com momentum stocks headed south and proceeded to lose over 56% of their value in the next nine months. As investors sold the tech stocks they freed up money that needed to be invested in something else. That something else turned out to be value stocks. After Trend Management lost 19% in 1999, we made 47% in 2000 even as the Nasdaq crashed from 5132 to 2288. But, before we made that 47% in 2000, we lost another 15% going into the March top in the dot-com bubble. It was a very painful and miserable time for our investors and Mark personally. Starting on March 11 our bear market was over and the rest of the worlds bear market started.

Screen Shot 2019-02-05 at 11.13.31 AM.png

Will it play out the same way this time? No one knows for sure. If you look at the chart above, it shows what has happened to value stocks versus momentum stocks the last 5 years. We think that chart is very similar to the one above of tech stocks versus value stocks in the .com bubble. In 2000 you just needed to buy any stock with “.com” in its name and you made money. This year, until October, you just needed to buy Facebook, Amazon, Netflix, Google or any stock that does business with them. Large-cap tech dominated the indexes for the last five years. We don’t see that domination continuing. Just as money in 2000 fledthe dot-coms it will flee this sector. We hope to profit from it.

If I was a client, I would argue that IF there is a recession it will be like 2008 and not like 2001. OK let’s go down that path. In 2008 we had an over-leveraged banking system stuffed full of bad real estate loans. In 2001 we had a lot of fraud on Wall Street led by Enron and WorldCom. The difference in the recessions of 2001 and 2008 is that the bad dot-com investments weren’t a big part of the loans banks made. Those investments were funded by Wall Street and sold to the public through stock offerings. If you wanted to borrow from an Ozarks bank, the losses in Enron, WorldCom or the dot-com stocks had no effect on whether the bank COULD lend you money. In 2008 the decline in real estate loans in the U.S. affected all bank lending immensely. Credit stopped flowing. Banks not onlywouldn’t lend to you, but some called in their loans (BankSouth, Citizens National). In 2001 the losses from the dot-com fraud were felt by investors BUT NOT the banks or their borrowers. In 2008 everyone felt it. That’s the differencewe see and we think it’s big. We don’t see any asset class sitting in the banking system today that can cause the same reaction it did in 2008.

Assuming we are correct on this, the stock market’s decline is discounting aslowing of economic growth — not a collapse in economic growth. When that happens, you get 10% to 25% corrections but not 50% to 60% corrections like we did in 2008. So far this year the S&P 500 has declined 20% from its highs. The Russell 2000 is down 27.3% from its highs while the Value Line composite is down 25%. The markets have taken a pretty big hit this quarter.

Screen Shot 2019-02-05 at 11.14.37 AM.png

To give you some insight into how bad things have been in the stock market this year versus the economy, look at the chart above. In this example we define a correction as a 20% decline from the price of the stock market a year ago. This is different than how much the market has declined from its absolute top. Since 1963 there have only been two corrections in the S&P 500 of 20% or more when there was not a recession. Those two years were 1966 and the crash of 1987. In other words, those two stock markets declined more than 20% year-over-year even though the economy was doing well. We point this out to say that no one ispredicting a recession in 2019. We aren’t either. Assuming the economists are right on their no-recession call in 2019, by January, if the S&P 500 is trading at 2300 (6% from todays close) the index will be down 20% year over year. This would be only the third time in 56 years that has happened. Based on the past history of what happens when you have a 20% market decline when there is not a recession, we think there is a very good chance the market rallies from 2300.

If you are curious how many corrections there have been of 10% or more this decade, there have been seven since the Great Recession bear market of 2009. In each case those declines did not predict a recession. None of them felt good and this one is no different.

Where is the economic growth going to come from if the U.S. isn’t going into arecession like 2008? We currently believe there is a shortage of single-family housing in the U.S. In 2008 we think the U.S. overbuilt single-family homes by 3.2 million. Today we see a shortage of 2 million homes that need to be built. That matters when projecting where economic growth will come from. It doesn’t tellyou when it happens but that it should.

In 2008 there was no investment idea worldwide that would generate economic growth. Today we see the implementation of 5G as a major growth story for the world over the next three years. Every major country views 5G as crucial to its economic future. Implementation of 5G is viewed as a crucial precursor for the future success of a country’s economy. The world will spend on 5G no matter what. The U.S. will be no different. We think the activity in those two areas will keep the economy out of a recession.

We have structured our investments into three main groups of money to try and profit from whatever market we have coming next. They are dividend producers for cash flow, stock buyback companies and inflation hedges. We want toelaborate on how they will “work” together. Two of the groups should help us handle a bear market should we be in a recession. The other one is set up for an inflationary bear market where owning cash won’t be great.

Twenty five percent of our managed accounts are invested in income-producing stocks. Those are BGC Partners, CenturyLink and Newmark Group. The average dividend yield for these three investments at today’s prices is 10%. On average these three stocks will pay the portfolio a yield of 2.5% (25% of the portfolio times 10%=2.5%) in 2019. If you count the other dividends we get from our investments, we would have a total yield of around 3.6% for the entire portfolio. We plan to use the cash flow from these stocks to help fund the cash-flow needs of our clients. Should they not need any cash at this time, we will reinvest this cash flow in other areas beside the income group.

The second group is stocks that can and will buy back their stock should the market go down a lot. They will be dollar-cost averaging their stock purchases if the market declines. This group includes Apple, Banco Macro, Berkshire Hathaway, Data IO, Goldman Sachs, PNC and Wells Fargo. The percentage of assets in this group is between 30% and 35% of our accounts.

The last group is our inflation hedges. We have been building this group up over the last two years. This group includes Barclays commodity index (DJP), Exxon, Colombia ETFs, Ishares Latin America, Ishares Mexico, Nucor, Profire and Royal Gold. This group represents around 25% of our accounts.

We will use the cash flow from group one to buy other investments. Group two will be buying back their stocks, which will help their performance. Group three will lag the performance of the first two until the dollar goes down and inflation threats emerge. Once those fears occur (and they will), this group will lead our accounts performance.

The market decline in the fourth quarter was ugly. It really hit our accounts hard and we hate that. We think the decline is more about the fear of a recession than an actual one occurring. Wall Street is famous for predicting seven of the last tworecessions. We don’t see any changes that we want to make to the portfolios currently. We like what we own even if the world appears not to. We think our patience will be rewarded in 2019 with a profitable year.

Sincerely

Mark Brueggemann IAR

Kelly Smith IAR

Brandon Robinson IAR

What Would Make Us Worry

Ten years ago this month, the stock and bond markets collapsed after Lehman Brothers filed bankruptcy. For one day, 10 years ago, AT&T could not issue commercial paper that matured the next day. Investors were too afraid to lend AT&T money for one day. The S&P 500 declined over 55% from its highs during this period. The following companies either went bankrupt or were forced to restructure, Fannie Mae, Freddie Mac, General Motors, Chrysler, AIG, Wachovia, Merrill Lynch, Citicorp and Lehman Brothers. It was a scary time to be an investor. Local banks called in loans trying to raise money to help with their balance sheets. Virtually all future building projects were stopped. For an investor, it was a horrible time psychologically to live through. We want to congratulate all of you for making it through that period. Your account at Trend has been virtually 100% invested in stocks during this period. Ten years later the S&P 500 is at record highs. Your confidence in the world economic system not collapsing has been profitable.

We say all of that to remind you what a difference 10 years makes. Mark said it was the worst market he had ever seen (Mark started at Merrill Lynch in 1983). The bad news is we don’t think bear markets have been outlawed. We will enter another bear market at some point. We just don’t think we will see another “run on the bank” like 2008 for quite a while. Twenty percent declines in stocks can and will happen at any time. The bear market in 2008-09 hit the banking system. When the banking system gets hit, you are faced with the possibility of more than 50% declines in stocks. As we look at the banking system in the U.S today we think it looks very healthy. A healthy banking system keeps our fears low of repeating 2008.  

We want to highlight a letter we wrote to our clients almost six years ago. Here it is if you would like to read it:

https://www.trendmanagementinc.com/new-blog/2017/1/26/lets-fear-fear

 The interesting thing about that letter is we were sort of embarrassed to write it. We were predicting a big bull market in stocks. At that time, it wasn’t fashionable to say the stock market was going up. It was more fashionable to say the rally is over and we are going to experience another devastating bear market like 2008. At the time we wrote the letter the S&P 500 was at 1,425. Today it is around 2,900. Betting on all stocks going up made sense to us in 2012. Today it is a little less clear.

Let’s talk about one of our big predictions that has yet to happen. It may never happen. We think we are right on this one, even though our timing has not been great.

In March of 2016, we wrote that the U.S. dollar is going much lower, commodities are going much higher and emerging markets will benefit from this. Commodities have rallied about 10% since then but emerging market stocks and the dollar have been a mixed bag. Instead of declining as we predicted, the dollar is up 2% versus developed country currencies. Against emerging market currencies, the dollar is up 10%. Emerging market stocks have gone up but they have not done as well as American stocks. This has hurt our relative performance versus the S&P 500 the last two years. 

We continue to believe that the dollar is at risk of a very large decline. There are two big factors that have held the dollar up that we didn’t see coming in 2016. One is the U.S. continuing to increase its production of oil. The other is the currency market’s reaction to this trade war. 

We flat-out didn’t think oil production in the U.S. would make it to 10 million barrels a day. It is now 11 million barrels. The U.S. oil fracking industry is continuing to grow even though drilling for new wells is half of what it was at its peak. Something must give here, and we think it’s oil production declining. The increased oil production lessens our need to import oil, which is positive for the dollar. The U.S. is sending less money overseas for oil, which helps our currency.  Should oil production roll over, that would help our prediction of a lower dollar and higher commodity prices. 

The other factor in holding the dollar up is the Trump trade war. We have been predicting a trade war going back almost 7 years. It’s here now. There is an economic school of thought that in a trade war you buy the U.S. dollar as money comes from outside the country to build factories here. Those factories being built increase the demand for dollars.  At best we think that’s a short-term phenomena.  We aren’t big believers of this theory, but that theory has been winning versus our view. We think the more likely scenario is that our inflation in this country accelerates versus the rest of world causing our currency to decline. The currency markets hate inflation and I think ours will pick up versus everyone else’s. We are at full employment. We see wage growth accelerating above 3% in 2019. The Fed’s mandate is 2% inflation. When President Trump started this trade war he gave U.S. workers a better chance to increase their wages. We believe they will take advantage of it. When they do, we are concerned how the market will react to this.

We see the S&P 500 as being 15% to 20% over valued. We view commodities as being 50% undervalued.   To invest in this view, we have placed around 20% to 25% of your account in stocks we think will benefit from commodities going up and the dollar going down. We have three stocks that we don’t plan to sell based on our inflation views, BGC Partners, CenturyLink and Berkshire Hathaway. There could be more but those are the three we want to mention now. For older accounts these three positions represent around 30% to 35% of your accounts value. For now, lets say that our three core holdings plus our commodity/dollar investments represent 55% of our average accounts assets. Of the 45% that is left over, around 10% of that is in cash. This leaves us with 35% of our portfolio that we think is at a greater risk of a market decline should our view of inflation occur.  Should we decide to lighten up on stocks due to market concerns, this will be one area we look at. There has been only one time in the last 10 years when we raised cash due to market concerns, January of 2015. The cash level we raised back then was 20%. We reinvested that money back in the markets in August of 2015. We are not making a market call at this time, just alerting you to the possibility that we could do this in the future.

The average dividend yield of BGC Partners and CenturyLink is 8%. If we enter a bear market, those yields will help support the stocks. Berkshire Hathaway doesn’t pay a dividend, but it increased the price it’s willing to pay to buy back their stock this quarter. We view that as a form of a dividend and we think it would support the stock should times get tough. Berkshire Hathaway also has over a $100 billion in cash looking for a home.  That always helps in bad markets.

The question we get asked the most often is “Describe THE MOST LIKELY bearish scenario that causes you to get worried.”. Fair enough, here it is. If this market plays out like the bull market’s of 1999 and 2007, commodities will have to go up enough to cause the Fed to tighten more than the economy can stand. The most likely culprit of higher inflation is the price of oil. Oil prices went from $11 a barrel in January of 1999 to $32 by March of 2000. That was the end of the dot-com bubble and the economy entered a recession. In January of 2006 oil was at $60. By January of 2008 oil was at $100 (on its way to $150). The economy entered a recession in 2008. We think some combination of Fed tightening and higher oil prices (or the CRB index) could cause problems for this market. The average consumer in the US has very little excess cash flow. When the price of oil goes up, so do your car mileage costs, heating costs, airplane tickets, UPS shipping costs etc. The rising costs of everyday food and energy will keep the average consumer from spending it somewhere else. Hence the recession happens. 

If the key factor in the Fed’s decision to raise rates is rising inflation, then having money in inflation stocks should be the last area of the stock market to rally before this bull market is over. You can consider it a late economic cycle indicator. If the price of commodities never goes up, then theoretically the Fed could print all the money they want forever. In other words, the next 10 years would look a lot like the last 10 years. We view this as a low probability but it’s possible.  Commodity stocks won’t be as good an investment as owning the general market would be in a low inflation world, but they will do OK. If inflation comes back, these stocks will do much better than the general market or cash. 

If our scenario on inflation plays out like it did in 1999 and 2008, we would have the opportunity to raise cash by either selling the commodity plays if they go up a lot or selling the general market stocks if they didn’t. We will have to wait and see how this one plays out. No cycle ever repeats itself the exact same way on Wall Street, and we are sure this one wont either. Stay tuned.

If you have any questions on this feel free to give us a call (417-882-5746). Our holiday party is on December 20th this year. The time is 6-8 p.m. and it’s still at Highland Springs. We will send you an official invite in November.


Sincerely


Mark Brueggemann IAR                                Kelly Smith IAR                       Brandon Robinson IAR

Durable Goods Decline

In past letters we have written about a coming trade war with our economic partners and how we plan to deal with it. In this letter we will write about some of the problems the United States is facing in trade and how we think they might be solved. We will also give you some details about a new stock we bought called Banco Macro.

Trade war

It has been our view for the last 10 years that we will get into an economic trade war with the world. We think that trade war is here and it’s going to last awhile. The primary target of that trade war will be China. We want to show you in graphical form one problem the U.S. is facing.

Screen Shot 2018-10-13 at 9.22.55 AM.png

The chart above depicts our trade deficit with the world excluding industrial materials (this index excludes oil). The United States is running the world’s largest trade deficit ever in industrial goods. To try to fix this problem the Trump administration placed a 25% tariff on $50 billion of Chinese imports. Trump is considering an additional 10% tariff on another $200 billion of Chinese imports ($250 billion total).  Currently the United States only exports $133 billion to China while importing $521 billion. This trade deficit of $388 billion is what Trump is upset about. If Trump decides to place a tariff on another $200 billion of imports from China, it will be interesting to see what China does. China only imports $133 billion from the U.S., which means China can’t match Trump dollar for dollar on tariffs. Something will have to give.

It has been our position (and still is) that THIS trade war will be inflationary and not deflationary. Most economists disagree with us on this issue. They site the passage of the Smoot-Hawley bill in 1930 as proof of what happens economically in a trade war. That bill restricted trade using tariffs. Those tariffs are blamed for causing the depression. We agree that the Smoot-Hawley bill helped accelerate the depression but it’s more complicated than that. We like to remind those same economists that Richard Nixon and Paul Volker placed a 10% tariff on ALL imports (not just Chinese) coming into the U.S. in August of 1971. That trade war was the beginning of a 10-year run of inflation, not deflation.

How can you have two similar economic actions but dramatically different results? The answer is that focusing on just one variable (trade) is too simplistic. Here are a few of the questions that need to be answered to compare the two periods. 

• Was the Fed printing money or restricting money? 

• Was the banking system extending credit or calling in loans? 

• Was the collateral banks held increasing in value or decreasing? 

• Was the country starting the trade war a net creditor in trade or debtor? 

• Was the world on the gold standard? 

• Did the country that has a trade surplus get it by suppressing the consumption of its citizens? 

We won’t elaborate on all these points. However, we will review the responsibilities of being a creditor nation on the gold standard during the Great Depression.  

In 1930 the United States was on the gold standard (we are not now). This meant that every dollar issued by the government had to be backed by a certain amount of gold. Going into the crash of 1929 most countries were on the gold standard. The United States ran a huge trade surplus with the world (similar to what China is running today). It has been estimated that the United States and France in 1930 controlled over 60% of the worlds gold supply. They got most of that gold by running large trade surpluses with the rest of the world. Most of that gold was in the U.S. When the United States decided to restrict trade using the Smoot-Hawley bill, it also restricted the world’s ability to get access to gold to pay back their debts. The Smoot-Hawley trade war made it very difficult for debtors to get gold through trade to pay their creditors back. Today we don’t have that situation.

If we were in a similar situation with China today, the Chinese would have the ability to demand we pay them back in gold or some asset that our federal reserve can’t print. They can’t do that. Hence the U.S. could at any moment as a debtor country simply print $2 trillion and give it to the Chinese. In 1930 debtor countries could not print gold so it restricted their ability to create inflation. Today we don’t see that restriction. This is a big difference in why we think this trade war is more like 1971 that 1930.

The Chinese aren’t stupid. They are aware the U.S. could just print dollars to settle our debts. Accepting those dollars from the United States isn’t as great a deal as it was in the previous 20 years. Lately, China has been trying to buy our companies with their trade surplus rather than invest it in our treasury bonds. The problem with that idea is this administration will not allow them to buy out American companies. The Trump administration at every turn is blocking Chinese acquisitions of U.S. companies. The Chinese can buy our bonds but not our companies.

To make matters worse for the Chinese, in 2018, our Congress decided to cut taxes and increase spending. Those actions will cause the U.S. to run the largest peacetime budget deficit in modern history (around 6%). We are not only restricting what the Chinese can do with their U.S. dollars; we are making them less valuable by creating another trillion-dollar budget deficit.  

At some point in this trade war China will have some tough decisions to make. We don’t think three years from now China will have a $400 billion surplus in trade with the U.S. How will China replace that lost income? There are no other countries willing or able to replace the U.S. as a net trade debtor. Therefor, China will have to replace that lost demand by printing more money in China to stimulate their GDP. Its citizens’ consumption as a percentage of GDP has dropped from 50% a decade ago to around 35% today. In the U.S. it is around 70%. That will have to change. If you can’t sell to the U.S., you must sell to your citizens. 

Make no mistake about it, the game of world trade won’t be the same after this is over: new rules, new winners and new losers. We have placed our bets on who some of the winners will be. We think inflation will increase and stocks will do better than cash. If China decides to sell its U.S. treasuries it will cause rates in the U.S. to go up (which will slow down our consumption), but it will also FORCE China to increase their consumption to offset that. It will also cause the value of China’s currency to go up, which is one of Trump’s goals. It also will matter who buys those bonds. Will it be our Fed or the private market? We won’t know those answers until it happens (if it happens).

We think Trump has the stronger hand in this fight. We like to use this analogy to help prove our point. If a company’s largest client fires it to make a certain product in house, who initially suffers from this? It’s the company that lost the business (China) that suffers and not the client (USA). To survive, the company will have to take measures such as firing workers, cutting salaries and looking for new work. That takes time to do. We think this is the position China will be in soon. Fortunately for China, a government has the luxury of printing money to create work and pay its bills. A private company does not have that privilege. That helps. We think when they print more money it will help increase the odds of worldwide inflation. 

Every day brings a new press release on trade.  We can’t write about all of them. If you have any more questions on this topic call us. We are following the ebbs and flows of this fight very closely.

New stock: Banco Macro

We bought a new stock this quarter, Banco Macro. This is the first time we have bought an individual bank outside the United States. Banco Macro (BMA) is an Argentine bank. The country of Argentina has been an economic basket case this century. Its currency has declined from 3 pesos to the dollar to 28 pesos to the dollar in the last 10 years. The previous president was more of a socialist than a capitalist and she horribly mismanaged the economy. We really like the new president and hope he wins re-election. That said, we want to point out how well Banco did financially under both styles of government. During the previous presidency BMA had a return on equity of 25%, during the current presidency it has averaged over 28%. A good bank has a return on assets of around 1%. We own Wells Fargo and its ROA is around 1.25%. BMA averaged 3.85% under the previous presidency and 4.58% under the current pro markets administration. These are fantastic numbers. Most U.S. banks are leveraged 10 to 1. BMA has its leverage under 5. When you put it all together you get a stock with a 400% higher return on assets while using half of the leverage trading at half the price a U.S. stock would trade at. The dividend yield at the time we bought it was 3.6%.

So why did we only buy a one percent position? The political risk still scares us. Even though BMA has done well in both administrations, it’s still a wild card. What could happen politically five or 10 years from now? Should the stock decline into the 50s, we may add another one percent.

BGC Partners spinoff

We want to give you an update on BGC Partners (BGCP). Sometime this year the stock is going to split its real estate and financial business into two separately traded stocks. The real estate division is called Newmark Group. The finance division will continue to be called BGC Partners. We mention this because the stock exchanges are going to treat the spinning off of Newmark as an “ex-dividend” exchange. What that means to you is someday you will look at your account and see you own BGC Partners and Newmark stock. We place the value of Newmark at about $6 per BGC share. If BGC Partners stock price was trading at 12 on Monday and it spins off Newmark on Tuesday, you will see your BBC stock drop from 12 to 6 because of the dividend. Don’t be alarmed; this is how ex-dividend spinoffs work. The value of the two stocks in totality on Tuesday when added together would be 12. We don’t want you to be surprised to see BGC Partners drop 50% in one day because of the ex-dividend.

At today’s prices we think the new BGC Partners would trade around 6 bucks and have a 52-cent dividend (dividend yield 8.7%). We find that an attractive yield. We think we will hold onto both stocks after the Newmark spinoff. We do expect both stocks to go up. It is possible we might add to our BGC position after the split if it should drop versus Newmark.

Outlook

The equity markets are slightly up for the year. Our managed accounts are slightly down for the year. We think the markets are going to be more volatile than they have been the last three years. This volatility won’t be a lot of fun to watch on a day-to-day basis. The markets are trying to sort through the Trump trade war and what it means. We think its inflationary and negative for the dollar. The markets are betting the opposite of what we think which has hurt our performance this year. We will continue to work hard on this subject and keep you informed on what we think is the subject for 2018 and 2019.

Sincerely


Mark Brueggemann  IAR                        Kelly Smith IAR                      Brandon Robinson IAR 


6 Months of Low Volatility

“The stock market has just finished one of its least volatile six months in its history. A 5% market correction has not occurred in over 250 days. This won’t last. A normal, 10% correction might happen very fast, and be very scary.” Trend Management report July 1, 2017. 

We were eight months early in predicting when the return of volatility would occur. The market just had a scary 12% correction in February that brought some fear back into investors’ minds. Volatility is back and it’s going to be with us for a while. Buckle up. We will outline in this letter how we plan to deal with what is a more normal market now.

On February 6, the Dow Jones was down about 1000 points before the market opened. We took that opportunity to buy a 2% position in Goldman Sachs at the open. We filled at $242 and it closed that day at $258 (it’s now $252). Our confidence in buying Goldman that day was based on two things. The first was that it hit our buy price. The second was that we didn’t think the decline in the market that week was based on fundamentals. Wall Street had been gambling again, and they got caught on the wrong side of a bet. 

Wall Street loves to place bets on just about anything. The latest rage is betting on how volatile the markets are going to be. Wall Street created a product called the CBOE Volatility Index (VIX) that allows you to bet on the implied volatility of the market for the next 30 days. Starting in late 2016, this bet became a one-way street. Most of the money was betting on no volatility. For a while they were right. We figured this out in April of 2017 and wrote the above quote in July. We knew that when the first signs of volatility picked up, it would cause a total market rout as these positions unwound. We weren’t disappointed. To throw gas on the fire, academia has been writing white papers about how stocks that show low volatility, and smooth path dependency (don’t ask) will outperform the S&P 500. Money started flooding into these smart beta, low volatility funds in 2017. It was destined to end badly, and it did. 

There was a fund created called the Inverse Volatility Index Exchange Traded note. On February 1, it was trading at $125. On February 6, it was trading at $7.35. In four market trading days it lost 95% of its value. There was close to a billion dollars “invested” in this fund. The fund was set up to bet on market volatility. If the market wasn’t volatile you made money and it went up. If it became very volatile they would wipe you out and close the fund. On February 5, the market volatility that day caused a stop order to be filled and the fund was closed. By closing the fund, investors could not recoup the 95% loss they just took. 

This fund wasn’t the only one doing volatility trading. It was simply the most public. We will soon find out who owns this stuff when Wall Street gives their report. We have a theory who it is, and it’s not our U.S. financial companies this time.

The chart above is an index we created of four of the largest derivative bank dealers in Europe. We think somebody in this group is going to fess up to experiencing some problems. We think the most likely suspect is Deutsche Bank (DB). It just so happens they reported terrible earnings on February 2, and the market blew up later that day. They also warned again about their business on March 22. The market lost 5% right after that talk. We think there is a correlation between the two events. DB is over 20 times leveraged which is twice the leverage of a U.S. bank. Over half of their $1.7 trillion balance sheet is in something that is not a loan. A gamble so to speak. We think when they warned on February 2, it started “a run” on their positions that hasn’t ended yet. We have been looking to buy market breaks from “bad European bank” news for the last few months. The economy is good worldwide. Earnings for our stocks have been good. We think the recent volatility reflects gamblers getting caught on stupid trades. This isn’t new, but it usually takes time to work its way out. At some point, Europe will have to address this issue, and not kick the can down the road. We think that time is within months as opposed to years.

We have owned US Gypsum (USG) as a way to play the housing recovery. Our average cost is below $10. In the last week of March, Knauf made an offer to buy the entire company at $42 per share. Knauf owns 10% of USG. Warren Buffett owns another 30% of USG. Mr. Buffett agreed to sell his stock to Knauf if the USG board said that was a fair offer. We think Knauf will have to raise their price to seal the deal and we aren’t sure what that price will be. When one of our stocks is involved in a takeover bid we usually sell half to decrease our risk. In this case, we sold half of USG at $40 per share. We will ride the other half and hope for a higher offer. We think the biggest risk we face in the midst of this deal is that the U.S. government may not allow a foreign company to buy a U.S. company. We think they will allow it, but it’s not a slam dunk.

Two of our better performing stocks this quarter have been Maxwell Technologies and American Public. Maxwell was up 4% and American Public 72%. These two stocks have been a drag on our performance for the last few years. We have mentioned in our letters that American Public is the cheapest stock we own. The biggest problems for them have been a poor regulatory environment and the budget sequester. Both of those are getting better. Once Wall Street saw that and believed it, they bid the stock up a lot this quarter. American Public is no longer the cheapest stock we own. There are a few mergers going on in this area. This has helped drive the stock up. We are watching this one closely to decide what to do next. 

Maxwell is our green play on the electrification of cars. The years 2018 and 2019 will be pivotal years for them (their words, not ours). If they execute, we should have fun. If they don’t, we will sell this stock. We hope they get it right.

Our growth stock system has three stocks in it, Data I/O, Skyworks and Profire Energy. All three reported good earnings, and we continue to hold them. As a reminder, our system is not reliant on the price of the stock, but the operations of the company. Skyworks and Profire went up after their earnings and Data IO did not. They each still have our highest ranking and we will wait and see how they do on the next earnings report.

We started writing about a coming trade war with China in 2010 and 11. We think it’s safe to say we are in one now. President Trump wants to put 60 billion dollars’ worth of tariffs on a long list of Chinese products. You can learn a lot about the president’s views by reading what his advisors have written about trade. President Trump’s lead advisor on trade is Peter Navarro. We suggest reading his books on trade to get a feel for where this is headed. Here are two of the titles of books he has written, The Coming China Wars (2008) and Death by China (2011). We sure don’t see a middle ground for negotiations in those titles. This is going to be a long ugly fight. We don’t think this will be going away anytime soon. 

Our trade deficit with China is pushing $400 billion or 4% of their GDP. This is not sustainable. When we started talking about this years ago, we thought this imbalance would be corrected in one of two ways. Either the U.S. would place a tariff on any import coming into the U.S., or our currency would decline to make our exports more competitive. We thought the most likely outcome would be a decline in currency. When we came to that conclusion two years ago, we bought gold, commodities, and Latin American stocks in your account. So far, this has worked out. We still see more upside to those trades. The Trump administration will continue to use tariffs or some form of border adjustment taxes (Vat tax) as a way to even the trade flows out. We don’t see either of these two trends slowing down soon.

We are going to introduce a third way to stop trade imbalances. It’s one we think is becoming increasingly likely in the next five years. Capital controls. What are capital controls? They occur when the government places restrictions on what you can do with your money. For 40 years, ANYONE has been able to take money in and out of the U.S. without restrictions. By anyone, we mean foreign governments, their citizens, or U.S. citizens. We are now thinking there is a 25% chance (up from 0) this ends within the next five years.  

When we ran trade deficits over the last 30 years, those countries took that trade money and sent it back to the United States as an investment. For the most part, they have bought our government bonds with that excess cash. China has over $3 trillion of foreign exchange, and Japan has over $1 trillion. Most of that money is invested in the United States bond market. There is a growing school of thought (Michael Pettis, Richard Koo) that if you limit a foreigner’s ability to send the money back, you stop the actual PHYSICAL trade deficit. If you are thinking this is never going to happen, consider the following: The Trump administration has blocked four transactions in which a Chinese company wanted to buy a U.S. company. The dollar amount of those busted acquisitions is over $100 billion. That’s a form of capital controls in our opinion. The U.S. is dictating what people can and cannot do with their excess dollars. The United States is exerting control. That’s a form of capital control.

China is an example of a country that has capital controls on its people. You can’t legally take $50,000 out of China if you are resident. In the 1960’s and 1970’s, the United States had restrictions on where U.S. citizens could invest their money outside the U.S. That ended with the demise of Bretton Woods in 1973. In 2012, the Brazilian government tried to limit the amount of money that could come into their country to stop “hot money.” An example within the U.S. that a real old timer will remember occurred in 1933. When Roosevelt became president, he took over all of the gold in the U.S. He made it illegal to own gold.  If you owned gold as a citizen, you were forced to sell it back to the government. There is precedent for capital controls in this country and others.

If we went to full blown capital controls in the U.S., we think studying the Argentine economy this decade might help. They instituted capital controls when their currency was four pesos to the dollar in 2011. When it ended, it was 20 pesos to the dollar. Inflation in Argentina was around 10% in 2011, and four years later, it was around 40%. They blocked their citizens from freely using their credit cards in foreign countries. That helped keep dollars in the country.  We don’t think something that extreme would happen here, but we think the trend would be correct. Our currency goes lower, and our inflation goes up. In that environment you don’t want to be a bond holder or own your currency. It is this scenario we are trying to figure out how to deal with if the probability goes from 25% to over 50%. 

If you have any thoughts on this, or questions about your account, feel free to call us at (417-882-5746).


Sincerely,


Mark Brueggemann IAR                   Kelly Smith IAR             Brandon Robinson IAR


2017 Was a Very Good One For Stocks.

Trend Management’s Year End Report 2017

2017 was a very good one for stocks. The strength in the stock market incurred little volatility. This is unusual. The stock market had the least number of pullbacks in the S&P 500 in twenty years, leading investors into a false sense of security, if not complacency.  A more volatile market in 2018 is not an if, but a predictable when we’ll again experience a market correction. 

The period from 1996 to 2000 is our blueprint for what might happen in this cycle.  Peaceful, profitable 1995-1996 was very similar to 2016-2017.  During both periods, the Federal Reserve raised interest rates, yet the stock market continued to go up. Alan Greenspan, then-chairman of the Federal Reserve, gave a speech on December 5th, , 1996, calling the stock market “irrationally exuberant.” 

At the time, the S&P 500 was at 750. Under our current valuation system, we calculate the stock market  in 1996 was about 15% overvalued.  (We think it is similarly overvalued today.)  Four years after Greenspan’s speech, the S&P 500 was at 1500, for a gain of 100%.  Between 1996 and 2000, there were three corrections of 10% or more.  Contrary to Mr. Greenspan’s fears, the markets remained exuberant for another four years. 

No one, including us, knows how excited investors will be during any bull market, or can pinpoint the market’s exact top.  However, we think there are seven signs in most bull markets that indicate when the party is getting out of control, the market is topping out, and more caution is warranted.  In 1999-2000, one indicator after another flared red, and eventually, the market went bad.  Fast-forward to today, and no indicators have yet turned negative.  If they do, the market could still go up.  The market could also go down, before any indicators flare red.  Will that cause us to sell all our stocks? No, but it would signal time for caution.  

The money the world’s central bankers have printed over the past decade is going to go somewhere, and it’s our job to figure out where that is. Stocks will continue to be the main investment we make for our clients, but not the only one. We want to remind you that being cautious doesn’t always mean be in cash.

Screen Shot 2018-01-22 at 1.14.56 PM.png


We have written previously about why we have gradually invested in commodities. The chart above does a great job of illustrating how cheap commodities are, versus stocks. We are close to setting record lows on this index. If a chart is worth a thousand words, this one will save us a lot of typing. What the chart doesn’t convey is when commodities will start to out-perform stocks (the line moves back up). It also doesn’t note whether stocks go up, but commodities rise more, or stocks tank and commodities fall less. It does indicate there is value in owning stuff, versus stocks. It is our opinion, before this bull market in stocks is over, stuff will have a good, upside run, and we hope to profit from it.  We are actively looking for ways to invest more money in this area. Investments to date have worked out, and we would like to own more.

We started rolling out the growth stock system this quarter. We now own Skyworks Solutions, Data I/O, and in a few accounts, Profire Energy.  Profire sells burner management systems for the oil and gas industry, and the float is very small.  We have been cautious on how much we can buy, without disturbing the price of the stock.  Profire is also working on a system to lower the cost to transport oil and gas in pipelines. 

Skyworks gets 40% of its revenue from Apple, and we think this revenue stream is secure for now. What is exciting for Skyworks’ future is it appears to be a prime beneficiary of the move to 5G and the Internet of things (IOT).  5G stands for fifth generation wireless connectivity for mobile devices. What’s exciting about 5G is its wireless capacity to replace cable TV.  Verizon, AT&T, Sprint, and T-Mobile will also roll out this service in late 2018. This is the first serious competition to the cable bundle we have seen. 5G will not only benefit Skyworks, but also CenturyLink. Competition is coming to the last mile and we think it’s a good thing for our accounts.

Data I/O is a particularly interesting stock. It has a market cap of $100 million. It initiated a system to make semiconductors more secure from data hackers. It also develops hack-resistant chips for self-driving cars.  We have researched the system and think it has a chance to be a big winner, if Data I/O executes. It has announced customer wins with EBV Elecktronik, Maxim, and Renesas. This quarter, its revenue growth was 45% over the previous quarter, last year. Let’s hope that trend continues.

CenturyLink pays a dividend of $2.16.  At today’s price of $17.33, it represents a dividend yield of 12.46%. We think that yield is secure. We understand, when a stock has this high a dividend yield, the market is saying the dividend is going to be cut. We don’t agree. One of us is wrong. We hope it isn’t us. In the last month, seven CenturyLink insiders bought stock in the open market. We hope they are right.

We continue to like BGC Partners.  Sometime this year, it will spin-off to shareholders its real estate division, Newmark Group. When that occurs, the price of BGC’s stock will decline to reflect the spin-off. We have not decided whether to keep the Newmark stock, but will continue to hold our BGC stock.  At today’s price of $15.18, BGC yields 4.8%. We think that yield will continue after the spin-off. We will continue to update you on this in our next reports.

There is new tax law in 2018.  Here is a brief take of what we see in this legislation.  On the corporate side, the winners appear to be companies that spend a lot of money on capital expenditures (capex). These companies will now be able to write off 100% of their capex in the year they spend the money. This is a huge incentive for beneficiaries, primarily steel and telecom, to  spend more money to juice the economy.  

The potential losers are companies that gamed the tax system to lower their U.S. taxes on their intellectual property rights. These companies are mostly the large technology stocks, like Google, Apple, and Microsoft.  They placed their intellectual property in low tax havens like Ireland, and the Caribbean. We have read that the tax savings on this strategy was around 10% to 13%. We think that loophole has been closed, and it will affect a lot of high-tech companies.

We think the stock market has rallied this quarter on the perception the new tax law will spur record earnings.  Bank of America has issued a report projecting a 10% boost to its earnings.  Should that occur, it will help close the gap between today’s overvalued market and its historical mean.   The tax law will give stocks a short-term earnings increase, when first quarter stocks report at the new rate.   We will analyze these reports very carefully to identify what other things are in the legislation we aren’t yet aware of today.   

We won’t make investments in your account based on what may or may not happen as a result of new tax legislation.  Our continued focus is on the sustainability of our companies’ businesses, and if they execute on their business plans.  

We hope you had a happy 2017.  We will do our best to make 2018, a profitable year.  If you have any questions about this letter, or about your account, please give us a call (417-882-5746)


Sincerely,


Mark Brueggemann IAR                            Kelly Smith IAR                     Brandon Robinson IAR