Second Quarter Report 2012
Our managed accounts had a great first quarter followed by a crummy second quarter. Our returns for the year are positive but we took a pretty big hit this quarter which wasn’t a lot of fun to watch. With the exception of two stocks (American Public and Maxwell), the first quarter earnings reports from our companies were good. Later in this report we will show you some graphs of the stocks we own and the metrics we look at to tell us how those companies are doing. The problem we faced in the second quarter of 2012 is the same problem we faced in the second quarter of 2010 and 2011: which is the undue influence Europe is having on our markets. When I tell you we are suffering from Euro fatigue it’s an understatement. We are sick of this issue but it is the one we have to talk about again because it is the cause of the world’s problems at the moment.
Around 15 to 20 percent of the S+P 500’s earning come from Europe. Europe is an important part of the world’s financial system but they ARE NOT the main driver of the world’s economy, that honor would go to the U.S. and Asia. Europe is in a recession, the rest of the world is not at this time. Here are a few U.S. stats that we think matter quite a bit in judging the strength of our economy. Housing permits in the U.S. are up 30% year over year, car sales are up 20% year over year and bank loans are up 12% year over year. Now I will concede that the increases above are from a very low base but they are up strongly from last year and those are the best stats since the Great Recession started. As a frame of reference for those same economic numbers last year at this time housing permits were up 12%, car sales were flat versus the previous year and bank loans were up only 3%. Based on those numbers which we consider important, the economy is getting better in the USA and that momentum will continue. Europe is another story. If you look at just bank loans to individuals and corporations in Europe they are declining this year versus 2011. In 2011, European bank loans were up 3% versus 2010 so the economy in Europe is decelerating and heading the wrong way. When there is no increase in lending to consumers and businesses of Europe there is not going to be any growth in that region. We wrote six months ago that when the ECB printed a trillion dollars and loaned it to the banks of Europe at 1% it would solve this issue. We were right that it fixed the stock market going down, but we have been wrong on the economy of Europe getting better. When will this situation get better? Will it ever get better?
Our case studies for Europe and what they should do next are based on what happened to Latin America in 1982, Asia in 1997, Argentina in 2002 and Iceland in 2007. In the instances above each of those countries or regions defaulted on some of their debt, depreciated their currencies to gain a competitive export advantage, had their central bank print a lot of money to help their banks and instituted inflationary policies to paper away their debt obligations. Today those regions have a higher growth rate than Europe and the USA. In each instance above with the exception of Iceland, the U.S. stock market was higher three years later with an average gain of over 35%. Europe is in the process of doing all four of those remedies now. The United States was able to implement most of those four remedies by the middle of 2009. How can we tell when this European mess is over or at least have a decent guess it’s over? One of our favorite hedge fund managers is Ray Dalio who runs Bridgewater Associates, the largest hedge fund in the world. Ray has made a living trading macro events like what is happening in Europe and we have tried to read everything we can on him. He has said in the past there are three things you need to do to get out of a crisis: supply liquidity, change the accounting rules and provide a safety net to investors. We agree with that statement. Let’s use the USA crisis as an example of how those three steps played out in 2008-2009. Lehman Brothers goes bankrupt on 9/15/2008 with the S+P 500 trading at 1250. Immediately after the Lehman bankruptcy, the Fed started printing money and our Fed balance sheet doubled in TWO MONTHS. The Fed supplied liquidity immediately which fulfills step one of our three step process to get out of a crisis. Even with all of the money being printed fear and selling continue. The S+P 500 closes at 930 on 11/14/2008. In late September through November the Fed throws a safety net around U.S. bank deposits and money market accounts saying they are now guaranteed by the government and that no one will lose money in them. Even though Fannie Mae and Freddie Mac are in bankruptcy the federal government assures investor’s no one will lose money on their bonds. The safety net is employed and step two is fulfilled. The S+P 500 is unimpressed and closes December at 872 down 30% since Lehman went broke. In 2009, fear continues to run wild as the market is afraid of what happens when the banks mark their portfolios to market so, on the week of March 9th,2009 the U.S. Government postpones mark-to-market accounting. Accounting rules are changed because of the crisis. This was the last of the three steps to ending a crisis that needed to be completed. The market bottoms the week of the accounting change at 666 (down 46% since Lehman went under) and now is trading at 1314 four years later. Our financial leaders got the job done in less than six months using Dalio’s guideline as a road map. Four years later here is where Europe is today. The ECB is supplying plenty of money/liquidity to the system and it is our guess there is more coming so that step is completed. The next two steps have not been completed by Europe and that’s the problem we are dealing with today. Investors in European banks don’t have confidence whether their deposits are safe and so they are pulling their money out of the banks in southern Europe and sending it over here or to Switzerland or Germany. So this step has not been completed. There is also total confusion as to how the bonds of Greece or other European countries should be valued on a mark-to-market basis should one go into default. How should a bank value that bond particularly if the country gets out of the Euro and goes back to their original currency? Should you value the bonds at market value, hold to maturity value, mark to wish (my favorite) and what currency should you use to value it? These questions are still out there and unknown by us. As a history note, when all of Latin America went broke in 1982 our U.S. banks were TOLD to mark their loans at full value (even though they were in default and you couldn’t sell them at full value) until they could save up enough money to write them down. So we changed (lied) the accounting rules until we could deal with the issue in an honest manner. If we didn’t change the rules EVERY MAJOR MONEY CENTER bank would have been wiped out in 1982. Every one of them. Based on the above three step process for ending a crisis we are going to be dealing with Europe issues until they provide a safety net to depositors/investors and they learn how to lie on their accounting. I am confident they can learn how to lie because they are politicians but I am unsure when they throw the safety net out there to the depositors and investors. Until Germany agrees to a Euro wide bank FDIC deposit type system this is going to be a messy period for Europe. Money will continue to leave the weaker banks in the weaker countries until SOMEBODY says the ECB is standing behind these assets or those countries leave the Euro. The money that the ECB will print will slosh around the world and show up in U.S. Treasuries, stocks or German Bunds until confidence returns to European banks. This month the Europeans started giving money to their banks (Spain is getting 100 billion for their banks) which is a good start in restoring confidence but it’s not going to be enough. They must throw a safety net around these bank deposits so that money will come back into these banks and give investors incentive to LOCK in the higher rates these banks are offering. If there is no guarantee then rates will stay too high in the “bad” countries and too low in the “good” countries. The ECB has thrown two trillion dollars at this problem in the last three years with a trillion of that coming in the first quarter of this year. Most of that money has ended up in our stock market, U.S. treasuries or German bunds, but it has yet to help those countries who need it most. We hear a lot of investors say “Europe will be another Lehman moment and the world is unprepared for it”. I can assure you we worry about this a lot but investors are more prepared now than ever for a “Lehman” event. Before Lehman Brothers went bankrupt our banks held one billion dollars at the Fed as safe money for a rainy day. Today that number is 1.5 trillion dollars which is down from 1.7 trillion dollars early in the year. Keep in mind that the ENTIRE FED balance sheet before Lehman was “only” 850 billion dollars and now we have twice that sitting in their bank not counting any money that is floating around outside the bank. If that isn’t a sign that investors are rat holing money for an event I don’t know what else it could say. There is money sitting there waiting for a disaster and we may get it, but we are more prepared than ever to deal with it.
If you are still awake after reading about Europe we are going to visually show you what our companies have been doing the last five years. We have decided to show you a chart of a stock, and then show you a single metric we think matters to the performance of the stock. For the most part you will see the metric going up indicating the company is performing okay, and for the most part you will see the stock trading all over the place regardless of what the metric is doing. We thought this might be a better way to see how our companies are performing operationally and how the market for that stock doesn’t always go with the fundamentals.
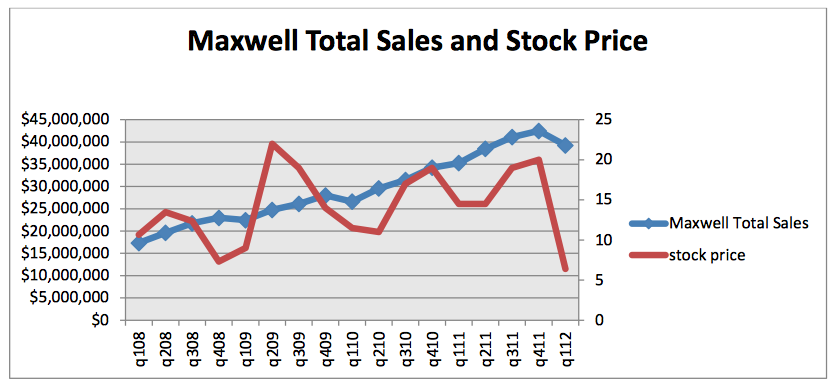
We want to show you Maxwell Technologies first because it had a bad quarter and its stock price took a beating because of it. In the last four years the company has grown its quarterly sales from $17 million a quarter to $40 million a quarter. In this economy that’s pretty impressive. So why is the stock down so much this quarter? Maxwell needed to sell $30 million worth of stock to build a new facility in Arizona to accommodate their rapid growth. They had sold $10 million dollars of stock before they lowered 2012 guidance on their sales growth from 25% a year to 17% a year. That’s all it took to take this stock down from $18 to $6. Their reason for lowering guidance was that new car sales in Europe are down because of the recession and we can see that as being legit. When the market thinks you need to sell $20 million dollars of stock in a bad market they kill you and that’s what happened here. The company has little debt and $30 million sitting in the bank so this isn’t a bankruptcy issue but a funding issue because they need to expand. Since the stock has plummeted we have had ten insider purchases of the stock from $10 on down (the Ceo and the chairman of the board bought the most) which is a pretty positive sign. The last time we saw this much insider buying in a company was at Rentrak when the stock was in the $12 range (it’s now $19). We don’t think Maxwell will sell stock down here (that’s according to Maxwell management) to fund that last $20 million dollars but the market disagrees. We think they will do some sort of a bank financing or bond sale to get the last $20 million they need for the new plant. As long a they keep growing sales we think they will either be bought out or the stock will go back up to the $20 area.
Speaking of Rentrak here is their stock price and the sales of their AMI division. The AMI division is the future of Rentrak and it is the service that now tracks all of Springfield Missouri’s television ratings by computer versus Nielsens journal entry business. Take note of how sales accelerated last quarter. The ramp is here for Rentrak

American Public group was the other stock to have a bad earnings report. To combat students who take out school loans just to get the money but don’t go to school, they instituted some tough anti fraud measures this quarter that hurt their sales. They changed the system and we are waiting to see how sales look. We had a large insider buy two weeks ago, so we hope he knows the results. Sales have been great here for the last four years and this is their second mishap that they have gone through in that time. The last one was temporary and we think this one will be too. This is probably our cheapest stock right now versus its historical growth rate.

Level3. As you can see on this chart the integration mess up in 2008 killed their ebitda and stock price. The ebitda line turned up in 2010 and we are waiting for the stock to do the same.

Berkshire Hathaway. Non insurance earnings year over year are at an all-time high. Buffetts stock buyback price is around $78 (the stock is $81). The stock is cheap.

BGC Partners. We are getting paid around 10% to hold this stock. The stock price has followed its pretax earnings pretty well. They have had some slower earnings lately because of the mess in Europe. We view this as temporary.

Corning. Earnings recovered in this stock but the market doesn’t believe they are sustainable. We disagree but for now the market is winning.

The last two charts are Macro charts we use to predict when we are headed into a recession. When interest rates go above the return that business’s can earn on their money, the marginal borrower is squeezed out and we are in danger of going into a recession. Right now there is no risk of a recession according to this metric.

The next chart is our fear index related to the credit market chart above. Currently, the crisis in Europe has not affected the flow of credit. The window is open to borrow money. As you can see in 2002 and 2008 that window was shut tight which helped cause the recession. Take note that this index was at higher rates nine months before Lehman went bust than we are now. The index is also at lower levels now than during the two previous European panics.

Our last paragraph today is to say thank you for your business. We know this last 18 months with its up’s and downs have been pretty frustrating. Our target for this year is still 1500 (we are at 1314 now) on the S+P 500 and in three years over 1700. We have tried to lay out to you what we think is the most important data to look at and why we think the market is headed up. As always, feel free to call us if you have any questions. Kelly will be back to work July 5th and so will our newest 8 week old analyst Beckham Smith. We think he is a superstar in the making.
Sincerely
Mark Brueggemann IAR Kelly Smith IAR Brandon Robinson IAR